// blog
What Is a Stock Screener and How It Actually Works
You open your broker screen, type a few symbols you recognize, and still end up staring at thousands of tickers. Some names look cheap, some look active, and a few seem interesting, but the list is too big to turn into a decision. That's the moment a stock screener earns its keep, because it turns a messy market into a rule-based shortlist you can work with.
A stock screener is a filtering tool that narrows a broad market universe using criteria you choose, such as price, volume, market cap, P/E ratio, moving averages, or chart patterns. One large screener description says it filters “thousands of stocks” and can save traders hours of manual research, while a historical screener example shows how some platforms now replay conditions on past dates by saving 110 ratios for 22,000 companies every day after a point-in-time database launch on 4 December 2015 Chartmill historical stock screener. The important idea is simple, but the mechanics matter.
Table of Contents
- The Core Idea Behind a Stock Screener
- How a Stock Screener Actually Works
- The logic is usually Boolean
- The data feed changes the result
- Common Fundamental Filters and What They Measure
- Valuation filters
- Profitability and growth filters
- Balance sheet and dividend filters
- Technical and Liquidity Filters Used in Active Screens
- Trend and momentum
- Volume and liquidity
- Why the combination matters
- Building a Real Screen From Filters
- A value-quality example
- A momentum-liquidity example
- Why the output changes so fast
- Limitations, Data Quality, and Stale Screens
- The four problems that matter
- Why coverage flags matter
- Using a Screener for an Existing Portfolio
- From discovery to discipline
- A simple operating rhythm
- Common Questions About Stock Screeners
- Are free stock screeners good enough?
- How often does the data refresh?
- Can a screener replace fundamental analysis?
- Do I need a screener if I already follow a watchlist?
The Core Idea Behind a Stock Screener
A newcomer often starts with the same feeling, a watchlist that's too long and no clean way to shrink it. A stock screener exists to solve that exact problem, by taking a huge equity universe and returning only the names that satisfy every rule you set.
A kitchen sieve or a coffee filter works by letting liquid pass through while retaining the solids. You pour in the whole batch, and the grounds stay behind. A screener does the same thing with market data, except the “holes” are your criteria, and the output is a shortlist of stocks that pass all of them.
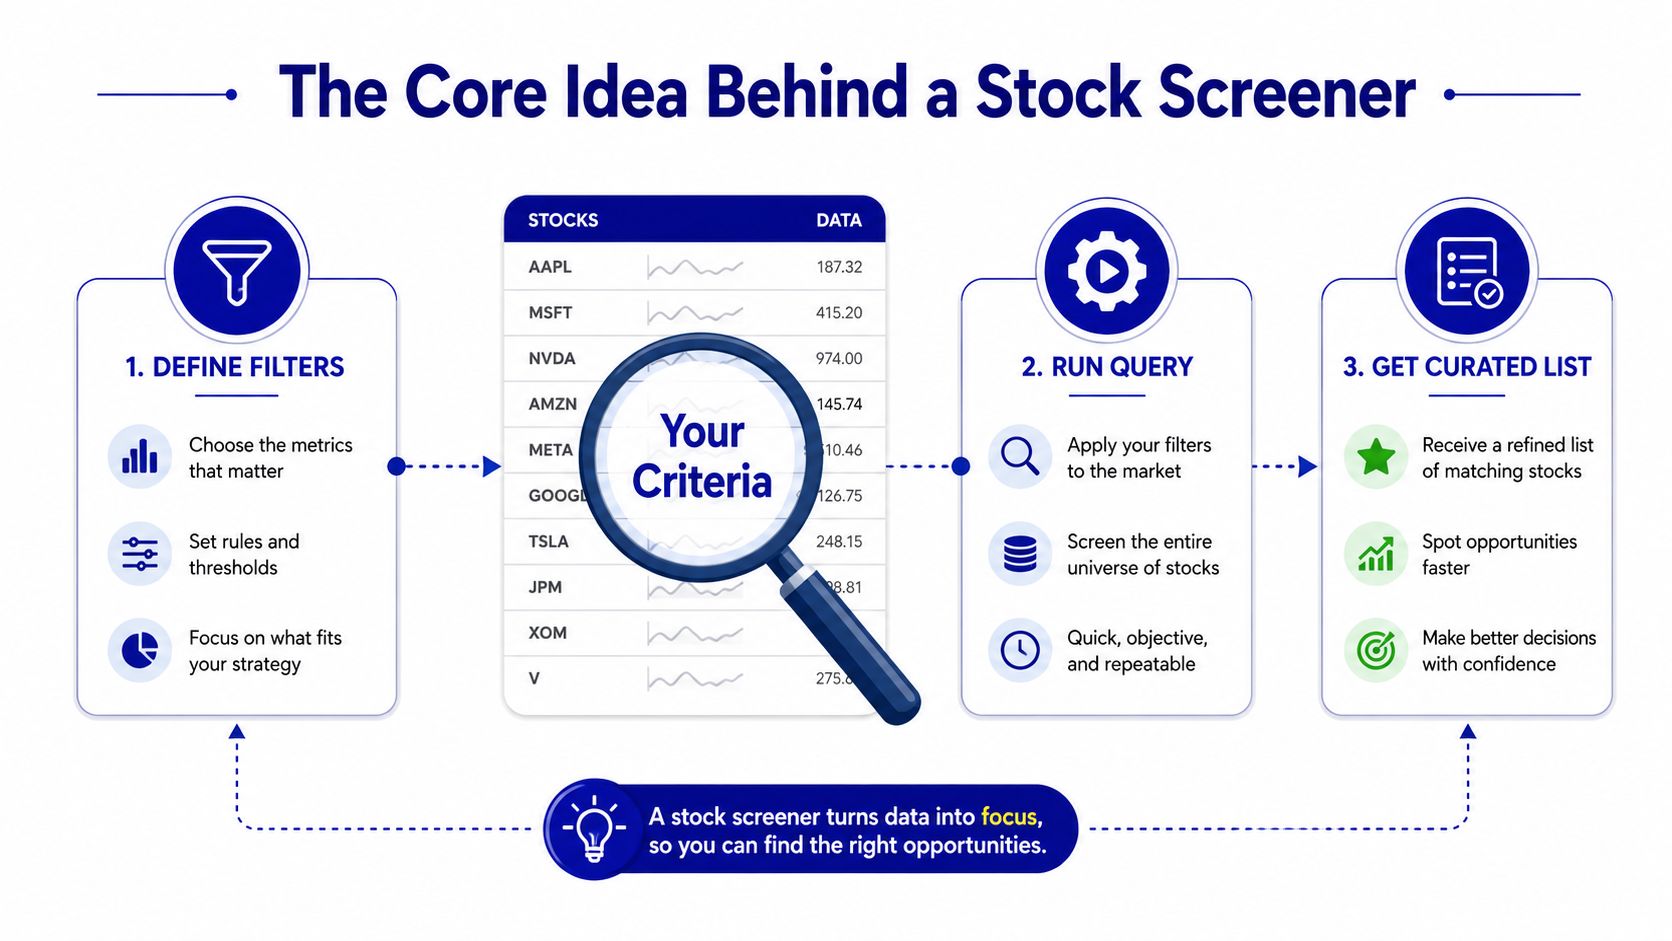
Practical rule: a screener is not trying to tell you what to buy. It's trying to tell you which names deserve your attention next.
That distinction matters. A charting platform shows price action, and a recommendation engine tries to suggest ideas. A screener is more basic and more powerful at the same time, because it's a transparent rules engine. You decide the rules, the database checks them, and the output is only as good as the logic you wrote.
This is why almost every disciplined equity workflow starts here. If you want value names, you filter for valuation. If you want momentum names, you filter for trend and volume. If you want income, you filter for dividends and balance-sheet strength. The screener doesn't replace judgment, it removes noise before judgment begins.
How a Stock Screener Actually Works
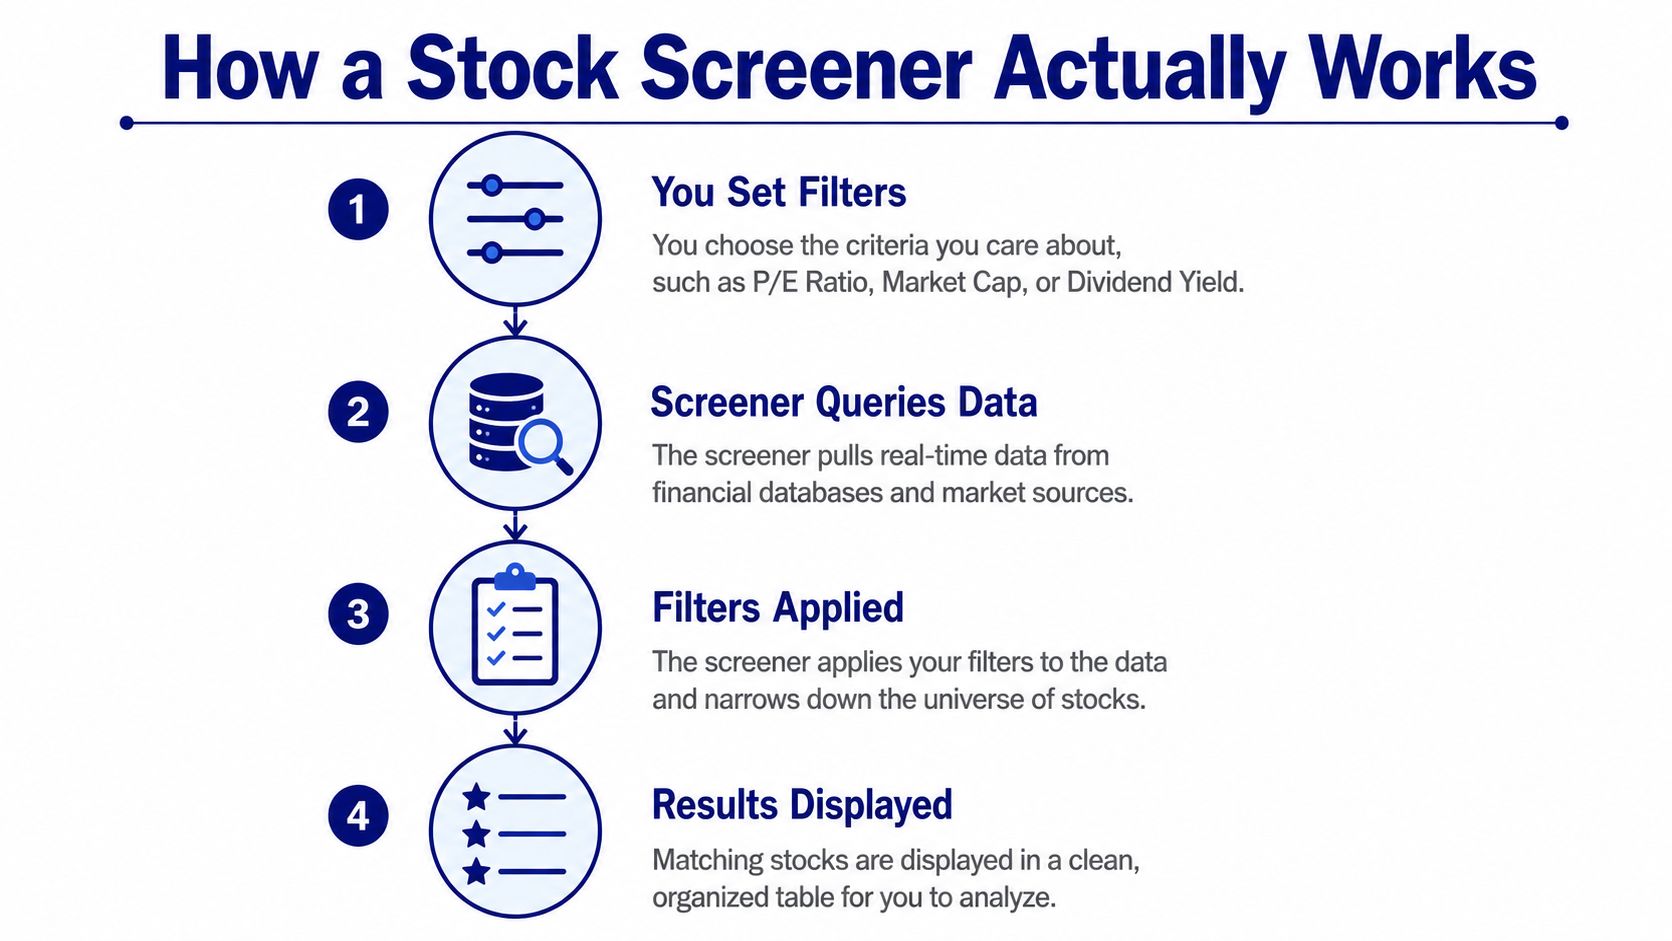
A screener is basically a query engine over a large stock database. You set conditions, the engine checks each ticker against those conditions, and it returns only the symbols that pass the full rule set.
The logic is usually Boolean
The easiest way to think about it is AND logic across categories. If you ask for stocks with a certain price, a certain market cap, and a certain valuation range, a stock has to meet all three. Some tools also let you use OR inside a category, which gives you more flexibility, but the output still depends on how the rules are grouped.
A simple screen might look like this:
- Universe: US-listed stocks
- Filter 1: Market cap above a chosen threshold
- Filter 2: P/E below a chosen level
- Filter 3: Positive earnings growth
- Filter 4: Acceptable liquidity
If a stock fails one rule, it drops out. That's why screeners feel fast. They're not scanning one chart at a time, they're running a structured test across the database and narrowing the result list immediately.
The data feed changes the result
The quality of the output depends on freshness, coverage, and missing-data handling. A screen that refreshes only once daily can behave very differently from one built on intraday data, especially when prices move quickly. Coverage matters too, because a screener that only knows one exchange won't behave like one that spans multiple markets.
A screener is only as smart as the data it's allowed to see.
One helpful way to think about the process is input, evaluation, output. You input rules, the engine evaluates each security against those rules, and the screen returns a manageable list. If the feed is stale, if fundamentals are missing, or if the universe is incomplete, the result can look precise while still being incomplete.
<iframe width="100%" style="aspect-ratio: 16 / 9;" src="https://www.youtube.com/embed/GPijFBy66LQ" frameborder="0" allow="autoplay; encrypted-media" allowfullscreen></iframe>
The point isn't that screeners are fragile. The point is that they're literal. They do exactly what you ask, not what you meant.
Common Fundamental Filters and What They Measure
Fundamental filters answer a plain question, how does the business look underneath the stock price? Long-term investors usually group them by what they reveal about valuation, profitability, growth, risk, or income.
Valuation filters
P/E, P/B, EV/EBITDA, and PEG all try to compare price with some measure of business value. A low P/E can look attractive, but it can also reflect weak growth, accounting noise, or a one-off loss that distorts earnings. P/B can help in asset-heavy businesses, while EV/EBITDA often gets used when debt and operating earnings matter more than net income.
Profitability and growth filters
ROE, ROIC, net margin, and gross margin tell you how efficiently a company turns revenue into profit. Strong profitability often helps separate a real business from a cheap-looking stock. Growth filters such as revenue growth and EPS growth add another layer, since a business can be profitable today but still be slowing down.
Balance sheet and dividend filters
Debt filters, including debt-to-equity, current ratio, and interest coverage, help you judge financial risk. Dividend screens often look at yield, payout ratio, and the pattern of consecutive increases, because income investors usually want cash flow that looks sustainable, not just high. A high yield with weak coverage can be a warning, not a feature.
| Filter Group | Example Metrics | What It Tells You |
|---|---|---|
| Valuation | P/E, P/B, EV/EBITDA, PEG | How expensive or cheap the stock looks relative to its fundamentals |
| Profitability | ROE, ROIC, net margin, gross margin | How efficiently the company earns profit |
| Growth | Revenue growth, EPS growth | Whether the underlying business is expanding |
| Balance Sheet | Debt-to-equity, current ratio, interest coverage | How much financial risk the company carries |
| Dividends | Yield, payout ratio, years of increases | Whether the stock fits an income strategy |
A strong screen rarely uses just one of these. Investors often pair a valuation filter with profitability and debt checks so the screen doesn't surface cheap but low-quality businesses.
Technical and Liquidity Filters Used in Active Screens
Fundamentals tell you what the business is doing. Technical and liquidity filters tell you what the stock is doing and whether you can trade it cleanly.
Trend and momentum
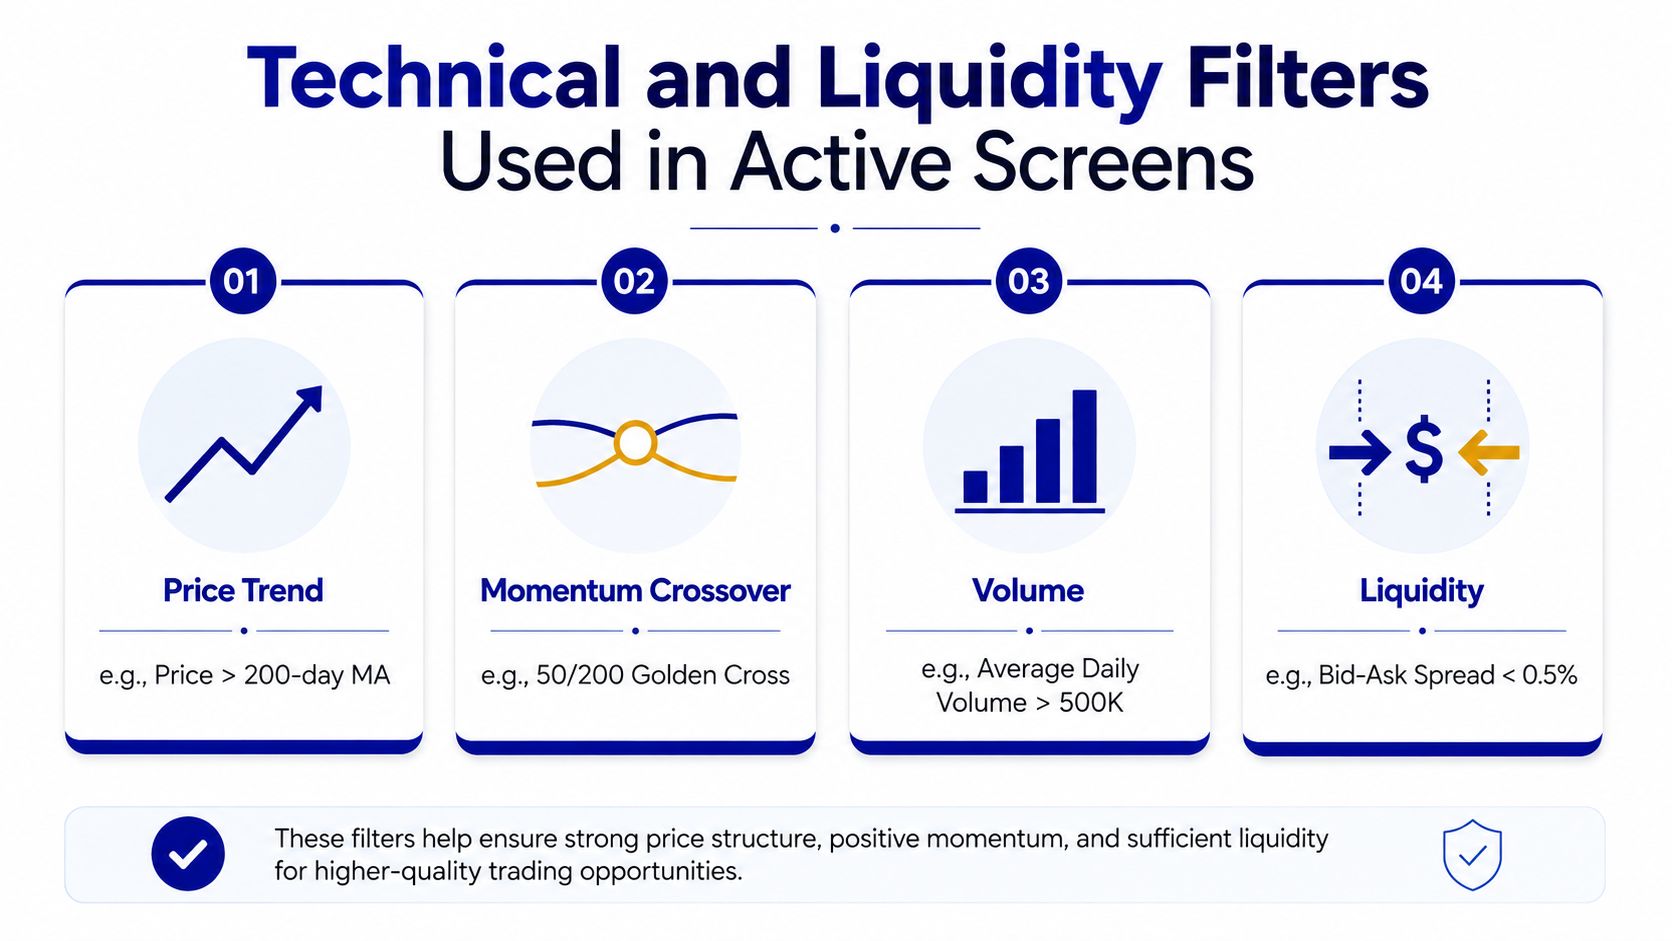
A moving-average filter, such as price above a long-term average, helps identify names in established uptrends. Momentum tools like RSI and relative strength are meant to show conviction, or at least persistence, in price movement. They're not predictions, they're conditions.
Volume and liquidity
Active traders care about whether they can enter and exit without turning the trade into a problem. That's where average daily volume, dollar volume, RVOL, and float matter. In practical screening guidance, higher-quality active candidates often use RVOL in the 1.5 to 3 times range, dollar volume above $5M, and ATR% around 2 to 4% to balance tradeability with enough movement to matter iTiger scanner guidance.
Why the combination matters
A stock can look great on momentum and still be untradeable if volume is too thin. It can look liquid and still be inactive if volatility is too low. That's why advanced screeners combine these metrics instead of leaning on a single field.
Tradeability rule: a name that's hard to enter cleanly is often a poor candidate, even if the chart looks impressive.
This is also where screen design becomes tactical. If you're screening for breakouts, you want conviction in the move and enough liquidity to support the trade. If you ignore those pieces, you can end up with a useful-looking list of stocks that may be difficult to transact in at size.
Building a Real Screen From Filters
A real screen works best when you can say what kind of investor it's meant to help. A long-term value screen and a short-term momentum screen should not look anything alike.
A value-quality example
Start with a broad universe, then narrow it with valuation and quality filters. A common structure is market cap, valuation, profitability, and debt. That might mean asking for reasonable P/E and P/B levels, solid ROE, modest debt, and positive growth over time.
The logic is straightforward. Cheap alone isn't enough. Quality alone isn't enough either. A screen becomes more useful when it asks whether the company is both reasonably priced and structurally sound.
A momentum-liquidity example
For an active setup, the screen shifts toward price action. You might look for price above a moving average, a momentum reading in a healthy band, rising relative volume, and enough dollar volume to support execution. That creates a list that's much closer to a tradable watchlist than a broad research bucket.
Why the output changes so fast
Small filter changes can reshape the list dramatically. Tighten one rule too far and the result can go empty. Loosen a rule too much and the shortlist stops being a shortlist. That's why screen building is iterative, not one-and-done.
If you want to compare how different tools handle this workflow, this Finviz comparison is useful as a starting point.
The best screen is the one that matches a decision you actually make. If you can't explain why each filter belongs, the list will drift away from your strategy.
A good habit is to build the screen, inspect the names, then tune one rule at a time. That keeps the process readable and helps you learn which criteria are pulling their weight.
Limitations, Data Quality, and Stale Screens
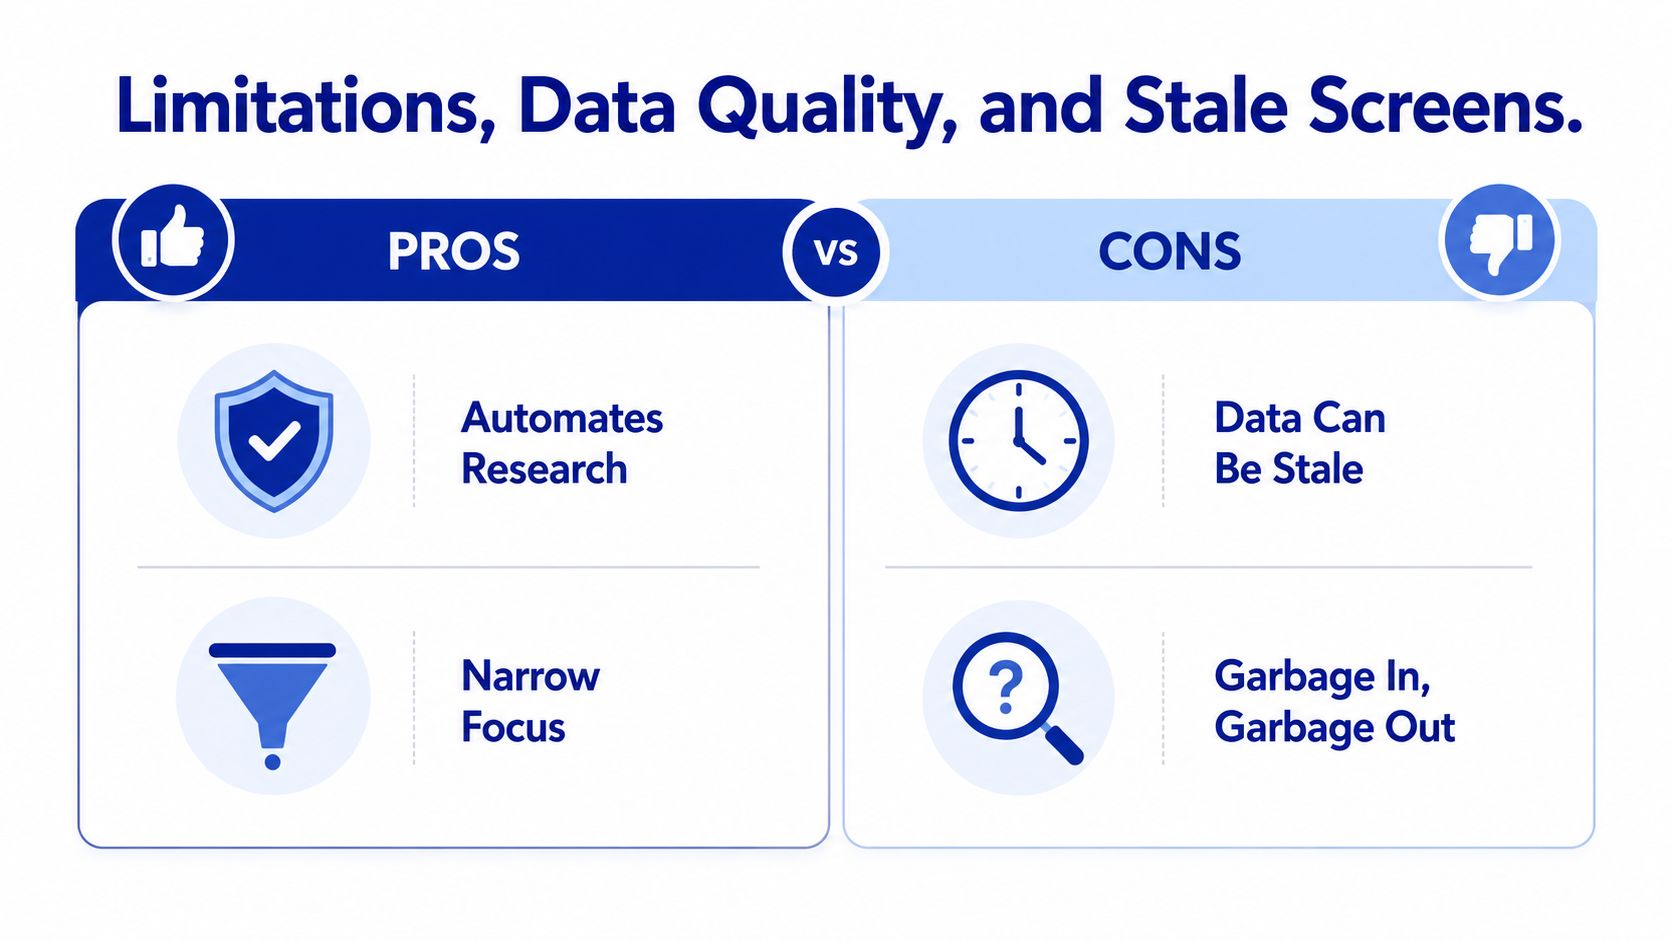
A screener feels objective, but the output can still mislead you if the data are stale or incomplete. That's the part many basic explainers skip, and it's the part that keeps the tool honest.
The four problems that matter
First, staleness. If a screener refreshes slowly, a name can look valid even after the market has moved on. Second, missing fundamentals. A small company with incomplete reporting may be excluded, or it may pass a rule in ways you didn't intend, depending on how null values are handled.
Third, survivorship bias. Historical screens can look cleaner than reality if delisted names disappear from the dataset. Fourth, the gap between discovery and monitoring. Most screeners are presented as tools for finding new ideas, but they're also a way to test whether current holdings still fit a written strategy.
Why coverage flags matter
A serious screener should help you see what's missing, not just what passed. The difference between “fails the rule” and “no data available” is important, especially across global markets, ETFs, or thinly covered names. If you don't know which of those cases you're looking at, you can draw the wrong conclusion fast.
For a deeper look at screening versus spreadsheet-based workflows, this comparison of stock screeners and spreadsheets is a useful reference.
Portfolio rule: if a screen can't tell you whether a position still fits, it's only half a tool.
The cleanest way to think about screening is this, it's the start of research, not the finish. A shortlist still needs reading, checking, and context.
Using a Screener for an Existing Portfolio
Many investors think of a screener as a buying tool. It can do that, but the more interesting use is after purchase, when you want to know whether a holding still matches the rules that justified owning it in the first place.
From discovery to discipline
A portfolio can drift. Valuation expands, growth slows, margins compress, or price action breaks the original setup. If you keep the rules written down, you can run current holdings through the same logic you used when you bought them and see what changed.
That's why many investors organize strategies as templates, such as value, quality, growth, dividend, or momentum. Each holding can then be checked against the right template instead of being judged on gut feel or memory.
A simple operating rhythm
The process doesn't need to be complicated. Write the thesis as a checklist. Recheck holdings on a regular cadence. Flag the names that no longer pass. Then decide whether the miss is temporary or a real break from the original plan.
Tools that score stocks against user-defined rules become useful, including systems like Monsa, which tracks whether holdings still fit the rules an investor has set.
The question changes from “what should I buy?” to “what do I still own that no longer fits?”
That shift matters because it gives the screener a second life inside portfolio management. It becomes a guardrail against thesis drift, not just a discovery machine for new ideas.
Common Questions About Stock Screeners
Are free stock screeners good enough?
Yes, for learning and broad idea generation, free screeners are often enough. Paid tools usually matter more when you care about data freshness, broader market coverage, or clearer handling of missing data.
How often does the data refresh?
Many reputable screeners refresh after the market close, which means they're better suited to end-of-day analysis than fast intraday decisions. If you need live or near-live data, you usually move into a more advanced, and often more expensive, setup.
Can a screener replace fundamental analysis?
No. A screener narrows the universe, but it doesn't tell you whether the story still makes sense. You still need to read the filings, understand the business, and decide whether the position size fits your risk.
Do I need a screener if I already follow a watchlist?
Probably yes. A watchlist helps you track names you already know. A screener helps you apply the same rules every time, so you're not relying on memory, recent headlines, or a vague sense that something “still looks fine.”
If you want a broader survey of research tools that sit around this workflow, this overview of stock research tools is a useful next read.
A stock screener is most useful when it behaves like a disciplined filter, not a magic answer machine. If you want a portfolio workflow that checks rules, surfaces drift, and keeps the focus on whether a holding still fits, visit Monsa and see how a strategy-versus-portfolio terminal applies those ideas in practice.
Monsa is a portfolio-analysis tool, not a broker or investment adviser. Nothing here is investment advice.
// related reading
Stock Screener for Fundamental Analysis: A Guide
What a stock screener for fundamental analysis actually filters, how to build one, and what to do with a stock once the screen stops watching it.
Value Investing Screener: What to Filter For and How to Build One
The metrics a value investing screener actually filters by, how to set thresholds that catch cheap stocks without catching value traps, and what changes once you own the name.
The 10 Best Stock Research Tools for 2026, Ranked
Find the best stock research tools for your workflow. We review 10 top platforms for screening, analysis, and portfolio discipline to help you invest smarter.
7 / 100 founding seats claimed - $100/yr locked, then $190/yr
Monsa is a portfolio-analysis tool, not a broker or investment adviser. It never recommends what to buy or sell - it checks what you hold against rules you wrote. Nothing here is investment advice.