// blog
The 10 Best Stock Research Tools for 2026, Ranked
You're probably juggling a screener tab, a spreadsheet full of ratios, a news feed that won't stop moving, and a half-finished memo that was supposed to explain why a stock still fits your thesis. That pile can feel productive, but it usually creates the opposite, too many inputs, not enough discipline. The best stock research tools don't just surface names, they help you move from discovery to analysis to ongoing monitoring without losing the thread of your original idea.
That matters because modern stock research is no longer just about finding cheap names or reading one good report. It's about comparing P/E, P/S, P/FCF, EPS, and D/E across time, checking whether a holding still matches your rules, and keeping the workflow repeatable when the market gets noisy. FINRA's investor guidance keeps coming back to those standard ratios for a reason, and historical data platforms make the comparison more useful by preserving long time horizons across the core financial statements (FINRA's stock evaluation guidance, Stock Unlock stock research product).
The right stack depends on how you work. Some investors need a fast screener, others need deep fundamentals, and some need a discipline layer that keeps a written thesis honest after the trade is placed. The tools below are grouped by how they fit into a workflow, not just by feature list.
1. Monsa
Monsa is built for the point in the workflow where most stock research tools go soft, after the buy decision. Instead of treating your portfolio as a pile of tickers, it stores your rules, scores each holding against them nightly, and shows which names still fit the thesis and which ones are drifting. For self-directed equity investors, that shifts the question from "What looks interesting today?" to "What still deserves capital tonight?"
The practical edge is the thesis-to-monitoring workflow. You can write a strategy in plain English, tune the criteria, and then let the terminal re-score holdings across 5 parallel portfolios and up to 50 tracked tickers, with 100 AI analyses a month for the judgment calls a number cannot settle. It also handles end-of-day fundamentals, prices, and FX for US and major European exchanges, so the book gets checked against fresh inputs instead of stale assumptions.
What makes it different in practice
The matrix view is where Monsa earns its keep. You can see every stock against every strategy, with fit scores, per-criterion verdicts, and coverage flags. That makes it easier to spot when a portfolio no longer lines up with the philosophy that justified buying it, without rebuilding the whole case from scratch. Value, quality, momentum, and GARP investors will feel that difference quickly, especially when they want a repeatable check instead of another round of manual review.
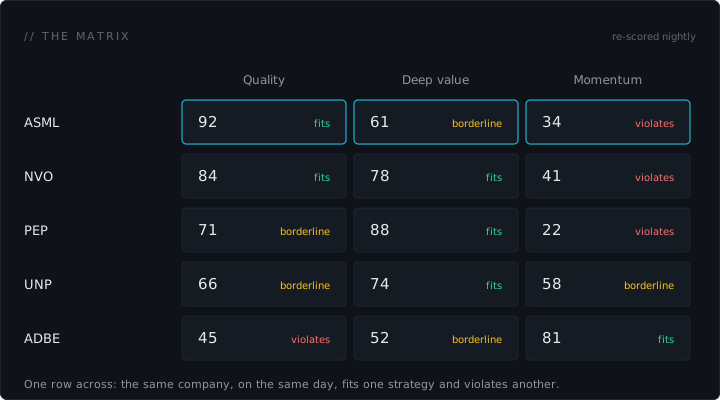
Practical rule: if you already write investment memos, Monsa helps you turn them into a working process. If you do not have written rules, the tool will expose that gap quickly.
The trade-offs are clear. Monsa is paid from day one, at $19/month with a founding annual seat at $100/year for the first 100 annual subscriptions, and it is explicitly an analysis terminal rather than a broker. It does not place trades, does not run backtests, and works on nightly data instead of real-time execution. Where it reads an Interactive Brokers statement, the connection is read-only. That makes it a discipline layer, not a trading surface, which is the right role for investors who care about thesis integrity.
If you want to compare a rules-based monitoring workflow with a faster visual screener, the Monsa versus FINVIZ comparison gives a direct read on whether you want speed or structured follow-through.
2. FINVIZ Elite
FINVIZ is the fastest way to turn the whole market into a short list. The free tier is already a capable screener; Elite adds real-time quotes, advanced charting, heatmaps, alerts, and data exports. Its strength is idea surfacing: dozens of filters, instant visual feedback, and a UI light enough that a first pass over thousands of names takes minutes.
The trade-off is depth. FINVIZ tells you what looks interesting right now; it holds no opinion about your thesis and keeps no memory of why a name made the list. That makes it a natural first stage in a stack, with analysis and discipline layers behind it.
- Best for: Traders and investors who want rapid screening and visual scanning.
- Strongest use case: Compressing a huge universe into a watchlist worth reading.
- Main limitation: No fundamental depth and no follow-through after the screen.
3. Stock Rover
A value investor building a watchlist for bank, industrial, and software names will get more out of Stock Rover than out of a flashy charting app. The platform is built for people who want to screen on fundamentals, compare holdings side by side, and keep a close eye on portfolio exposure without jumping between several tools. Its strength is practical breadth, with 700+ metrics for screening and custom views, plus portfolio analytics and broker connection with select brokers.
The advantage shows up in a repeatable workflow. The free tier makes it easy to test the basics, and the 14-day Ultimate trial gives enough room to see whether the interface and data density match your style. If you prefer working through many metrics instead of relying on a polished dashboard, Stock Rover gives you that control. The trade-off is that dense tools can slow you down if your process is not already defined, and the more advanced tiers may feel expensive if you only need a small slice of the feature set.
Stock Rover is useful as a screening layer and a tracking layer, but it asks you to do the thinking. It can surface undervalued names, quality screens, and portfolio concentrations, yet it will not decide which factor mix matters most for your strategy. It also pairs well with a thesis-checking tool, and the Stock Rover comparison with Monsa helps clarify whether you want a broader fundamentals workspace or a more rules-based monitoring layer.
- Best for: Investors who need a fundamentals-heavy screen and portfolio review tool.
- Strongest use case: Comparing holdings on valuation, quality, and exposure in one place.
- Main limitation: It can feel crowded without an already-defined screening process.
4. Koyfin
A common Koyfin workflow starts with a screen elsewhere, then shifts into Koyfin for context. An investor might pull a name from FINVIZ, open it in Koyfin, and then move from price and valuation checks into transcripts, filings, and recent news before deciding whether the setup still deserves attention. That handoff matters because Koyfin is strongest as the analysis layer after screening, not as a replacement for the first pass.
Koyfin gives you global fundamentals, estimates, transcripts, filings, and news in one interface, along with custom dashboards, formulas, templates, and alerts. In practice, that means you can compare a company's reported numbers with analyst expectations, scan the latest document flow, and keep the same view saved for later review. It also handles ETF holdings and broader market data, which helps if your research stack covers both individual names and portfolio context.
The free tier is useful for testing the workflow before you commit. Paid access is generally more approachable than large institutional systems, but the core value comes from whether you build repeatable dashboards and use them in a consistent research routine. For investors comparing it against other analysis tools, the Koyfin versus Monsa comparison helps separate a broad market dashboard from a more rules-based monitoring approach.
- Best for: Investors who want screening-to-analysis context in one workspace.
- Strongest use case: Reviewing transcripts, filings, and market context after a screen.
- Main limitation: Broad enough to stay flexible, but it still asks you to do the organizing.
5. TIKR
TIKR becomes useful the moment a current valuation starts to feel suspicious. If a stock looks cheap on a P/FCF basis today, the key question is whether that discount is new, temporary, or just normal for the business. TIKR lets you compare that reading with long-history fundamentals, then check management commentary, analyst estimates, and ownership changes in the same place. That turns a surface-level ratio check into a fuller research step.
The practical value comes from seeing the cycle around the number. A company can trade below its usual multiple for good reasons, or it can look expensive after a temporary margin dip that management has already explained in prior calls. TIKR gives you the history to separate those cases, with long-run financial statements, extensive transcript archives with audio and slides, analyst estimates, and ownership data across global markets. Pricing runs from a free tier to a $24.95/mo Plus plan and a $54.95/mo Pro plan with the full history and superinvestor tracking (TIKR review - SpotSaaS, TIKR review - TraderHQ).
TIKR's trade-off is straightforward. The broader archive, estimate views, and ownership data are most useful if you know you will return to them often, and some of the deeper data sits behind higher tiers. If you only review a stock occasionally, the platform can feel like more tool than you need, but for repeat analysis it fits cleanly into a research stack built around screening first and conviction later.
- Best for: Transcript work, historical fundamentals, and comparable-company research.
- Strongest use case: Deep diligence on businesses with meaningful operating history.
- Main limitation: Higher-value datasets are plan-gated.
6. Finbox
Finbox is built for investors who care about transparent valuation work. It licenses S&P Global Market Intelligence data and combines 1,000+ metrics with screeners, peer comparisons, and editable valuation models like DCF, dividend discount, and comps. That makes it a strong fit for people who want to see how the model is built, not just what the output says.
The Data Explorer and metric definitions are important here. When you're modeling a company, clarity about the underlying data can matter more than flashy visuals. Finbox leans into that clarity, which makes it attractive to investors who want auditable, structured work instead of a narrative-heavy interface.
It's not the right answer for every workflow. The interface is utilitarian, and that's part of the trade-off. If you want polished charts and broad qualitative content, you'll probably prefer another platform. If you want valuation discipline and custom models, Finbox is a strong candidate.
Practical rule: use Finbox when the decision hinges on intrinsic value, assumptions, and peer comparison, not on market sentiment.
- Best for: Transparent valuation models and metric-heavy analysis.
- Strongest use case: DCF, comps, and peer-based valuation work.
- Main limitation: Functional over visual, with limited qualitative depth.
7. Seeking Alpha Premium
Seeking Alpha blends crowd-sourced research with systematic signals: Quant Ratings and factor grades sit beside thousands of contributor articles, earnings coverage, and screeners built on both. For idea hunters, that mix is the draw, a quantitative first read on valuation, growth, and momentum, plus long-form arguments from people who hold a position and say why.
The trade-off is variance. Contributor quality ranges widely, and an investment case is only as good as the author behind it, so the quant layer works best as the filter and the articles as context rather than as the decision itself. The service is sold as an annual subscription, with periodic promotional pricing.
- Best for: Idea hunters who want quant signals plus crowd research in one place.
- Strongest use case: A first structured read on a name before deeper diligence.
- Main limitation: Article quality varies by author; the ratings are the stable part.
8. Morningstar Investor
Morningstar Investor is useful when an account holds individual shares, ETFs, and mutual funds together, because the portfolio X-Ray view can show overlaps that are easy to miss in a simple holdings list. If a dividend-heavy portfolio looks diversified on the surface but leans hard into the same sectors, that check matters fast.
That portfolio view sits alongside analyst research, proprietary ratings, and screening tools for stocks, funds, and ETFs. The practical value is not that Morningstar replaces your own work, but that it gives you a structured starting point. You can screen for candidates, read the reports, then see whether the position fits the broader allocation you already hold. The reports provide organized commentary and a consistent framework, which helps when you want a clear read without building every assumption from scratch.
The trade-off is familiar. Morningstar handles portfolio review and single-name research in one place, but the product still feels closer to a fund-first platform than a pure equity terminal. That works if your stack includes ETFs and funds. It feels less natural if you only care about individual stocks and want a heavier emphasis on custom modeling. For a comparison of a broad retail research workflow against a rules-based monitoring terminal, see Monsa versus Morningstar.
- Best for: Mixed portfolios that include stocks, ETFs, and funds.
- Strongest use case: Portfolio X-Ray, analyst reports, and screening in one workflow.
- Main limitation: Less specialized for pure equity modeling than research-first platforms.
9. Simply Wall St
Simply Wall St fits early-stage review work because its visual fair value and narrative model turn equity research into infographics and story-style reports, so you can scan valuation, quality, and risk without wading through a dense workbook.
That speed matters in real workflows. Many investors are not trying to write a full memo on every holding. They are trying to sort the names that deserve a closer look from the names that can wait, and Simply Wall St reduces friction at that point. Its global coverage and weekly portfolio emails also make it useful for light-touch monitoring between deeper review sessions.
The trade-off is detail. Visual summaries are easy to absorb, but they can hide the underlying drivers behind a rating or fair value estimate. If you need raw tables, fuller context, or more flexible modeling, the platform can feel thin once you move past the first read. Use it at the front of the research stack, not the center of it: start with the visual summary, decide whether the company still merits attention, then move into a more detailed tool if the name survives the cut.
- Best for: Quick triage and visual portfolio monitoring.
- Strongest use case: Investors who want narrative summaries and easy-to-scan visuals.
- Main limitation: Serious analysts may outgrow the plan limits and simplified views.
10. YCharts
YCharts is built for advisors and communication-heavy investors who need strong charting, exportable visuals, and client-ready outputs. It covers equities, funds, ETFs, indices, and macro series, and it combines that breadth with screeners, dashboards, model portfolios, and Excel add-ins. That makes it especially useful when the final product is a report, a deck or a proposal rather than the research itself.
The platform's strength is presentation quality. If you need charts that can go directly into client materials, or if you regularly compare assets in a polished format, YCharts does a lot of the heavy lifting. It's a strong fit for RIAs and other professionals who care about communication as much as analysis.
The trade-off is depth of unstructured content. YCharts is excellent for quantitative work, but it doesn't aim to replace transcript libraries, broker research, or broad document intelligence. Its pricing is sales-quoted, so it's less of an off-the-shelf retail buy and more of a professional platform decision.
- Best for: Advisor workflows and client-ready visuals.
- Strongest use case: Reporting, proposals, and polished portfolio communication.
- Main limitation: Less suited to deep qualitative research.
Top 10 stock research tools comparison
| Product | Core features | Stands out for | Price and value | Target audience |
|---|---|---|---|---|
| Monsa | Natural-language strategy capture; 10 editable templates; nightly fit scores; matrix view; portfolio guardrails; 5 parallel portfolios and up to 50 tracked tickers; 100 AI analyses/mo | Turns a plain-English thesis into checkable rules with nightly enforcement and transparent reported/derived/missing flags | $19/month; $100/year founding seat for the first 100 annual subscriptions | Self-directed investors, indie PMs, small RIAs, stock pickers |
| FINVIZ Elite | Advanced screener, real-time quotes and charts, heatmaps, alerts, exports | Extremely fast idea surfacing in a lightweight UI | Freemium; Elite is the paid tier | Traders and rapid screeners |
| Stock Rover | 700+ metrics, deep screener, portfolio analytics, broker sync, PDF reports | Deep fundamentals with broker-synced portfolios | Free tier plus paid premium tiers | Fundamentals-first retail investors |
| Koyfin | Global fundamentals, transcripts, filings, custom dashboards, screeners, alerts | Flexible dashboards and fast visualizations | Free tier plus paid plans | Investors and advisors who live in dashboards |
| TIKR | Long-history fundamentals, transcript archive with audio and slides, estimates, ownership data | Extensive historical data and transcripts | Free tier; $24.95/mo Plus; $54.95/mo Pro | Long-term researchers and analysts |
| Finbox | 1,000+ metrics, data explorer with definitions, editable DCF and comp models, peer comparisons | Auditable valuation models on S&P data | Flexible pricing with entry-level options | Valuation analysts and modelers |
| Seeking Alpha Premium | Quant Ratings and factor grades, screeners, author tracking, AI summaries | Community research blended with systematic quant signals | Annual subscription | Idea hunters mixing quant and crowd insight |
| Morningstar Investor | Analyst reports, proprietary ratings, portfolio X-Ray, screeners | Analyst coverage plus portfolio X-Ray across asset types | Retail subscription | Retail investors wanting analyst and portfolio tools |
| Simply Wall St | Visual fair-value and narrative models, infographics, portfolio analytics, alerts | Highly approachable visuals and story-style reports | Freemium with plan limits on reports and views | Newer investors, quick triage and monitoring |
| YCharts | Charting, screening, dashboards, model portfolios, Excel add-ins, client deliverables | Advisor-grade visuals and client-ready exports | Sales-quoted professional pricing | RIAs, advisors, professional teams |
Vendor pricing as listed publicly in August 2026; check each product's site for current figures.
Building your stack: a 3-step research workflow
A single tool rarely covers the whole investment process. The cleanest way to think about stock research tools is as a stack, where each layer has one job. Discovery finds names, analysis tests the case, and discipline keeps you honest after you buy.
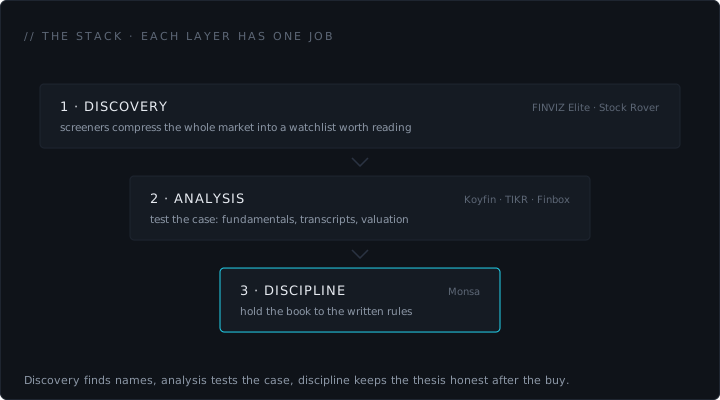
1. Discovery, wide funnel. Start with a screener like FINVIZ Elite or Stock Rover to compress a huge market into a watchlist that deserves attention. FINVIZ is better when you want speed and visual scanning, while Stock Rover is better when your filters are fundamental and you want more metric control. Either way, the point is to reduce noise before you start reading.
2. Analysis, deep dive. Move your shortlist into a platform like Koyfin, TIKR, or Finbox. Use Koyfin for dashboards and context, TIKR for transcripts and long-history fundamentals, and Finbox when you want auditable valuation work that makes the math visible. This is the stage where you confirm whether the business quality, valuation, and management communication support the thesis.
3. Discipline, guardrails. Once you own the stock, use a tool like Monsa to codify the rules that justified the purchase in the first place. Monsa's nightly scoring, portfolio constraints, and per-criterion verdicts are useful because they force the book to answer a simple question, does this holding still fit the written strategy? That's the part most research stacks miss, and it's where emotional drift tends to creep in.
The best stack is the one that matches your process. A value investor might use Stock Rover or Finbox for the first pass, TIKR for transcripts, and Monsa for ongoing discipline. A more visual investor might start with FINVIZ, validate in Koyfin, then monitor in Monsa once the position is live. Advisors may prefer YCharts for client-ready output and Morningstar for portfolio context.
What matters most is continuity. Research works when the same logic carries from screening to diligence to monitoring. If your current setup makes you re-interpret the thesis from scratch every time a stock moves, your tools are helping you discover ideas, but they're not yet helping you manage conviction.
If you want a stock research stack that doesn't stop at screening, Monsa is built for the discipline layer. It stores your rules, rechecks holdings nightly, and tells you when a position no longer fits the thesis you wrote down. Visit Monsa to see how a strategy-first terminal can help you monitor your portfolio with more consistency and less drift.
Related reading: 10 Best Growth Stock Screener Tools for 2026 and What Is a Stock Screener and How It Actually Works.
Monsa is a portfolio-analysis tool, not a broker or investment adviser. Nothing here is investment advice.
// related reading
10 Best Portfolio Monitoring Tools for 2026, Ranked
What a portfolio monitoring tool actually needs to track, and a ranked look at 10 tools, from net-worth trackers to a rules-based scoring terminal.
What Is a Stock Screener and How It Actually Works
Learn what a stock screener is, how it filters thousands of stocks by fundamentals and technicals, and the limits to know before relying on one.
10 Best Growth Stock Screener Tools for 2026
Compare the 10 best growth stock screener tools for 2026. Find platforms with revenue, earnings growth, margin, and valuation filters for growth investors.
7 / 100 founding seats claimed - $100/yr locked, then $190/yr
Monsa is a portfolio-analysis tool, not a broker or investment adviser. It never recommends what to buy or sell - it checks what you hold against rules you wrote. Nothing here is investment advice.