// blog
7 Best Stock Analysis Tools for 2026
Title: 7 Best Stock Analysis Tools for 2026
A single platform rarely handles every stock-analysis job well. A screener can narrow a global universe, but it may not preserve a long-form thesis. A charting terminal can show price and macro context, but it may not tell an operator whether an existing holding still satisfies the rules written at purchase. Analyst research adds qualitative judgment, while portfolio oversight asks a different question entirely: does the book still behave according to its stated process?
That distinction matters as tools expand from isolated desktop utilities into broad, cross-border research platforms. Stockanalysis.com reports coverage of more than 100,000 global stocks across 92 countries and 136 exchanges, while another platform cited in the same market discussion covers more than 130,000 global stocks, ETFs, and funds. Modern products increasingly combine screeners, valuation models, earnings transcripts, analyst estimates, and historical fundamentals in one workflow.
This comparison assesses seven tools by the research problem each solves: fundamental history, visual market context, rapid screening, value research, analyst interpretation, mixed quantitative and human-authored coverage, and ongoing strategy oversight. The focus is process support, not predictions about outcomes. Monsa is the specialist option for operators who want each holding checked against explicit, written rules.
Table of Contents
- 1. Monsa
- How the workflow works
- 2. Stock Rover
- Where it fits in a research stack
- 3. Koyfin
- Why visual context matters
- 4. FINVIZ Elite
- The advantage is frictionless filtering
- 5. GuruFocus
- Examining a company's financial history
- 6. Morningstar Investor
- Analyst research versus personal rules
- 7. Seeking Alpha Premium
- Research breadth requires editorial judgment
- Top 7 Stock Analysis Tools Comparison
- Build a Research Stack That Matches Your Rules
1. Monsa
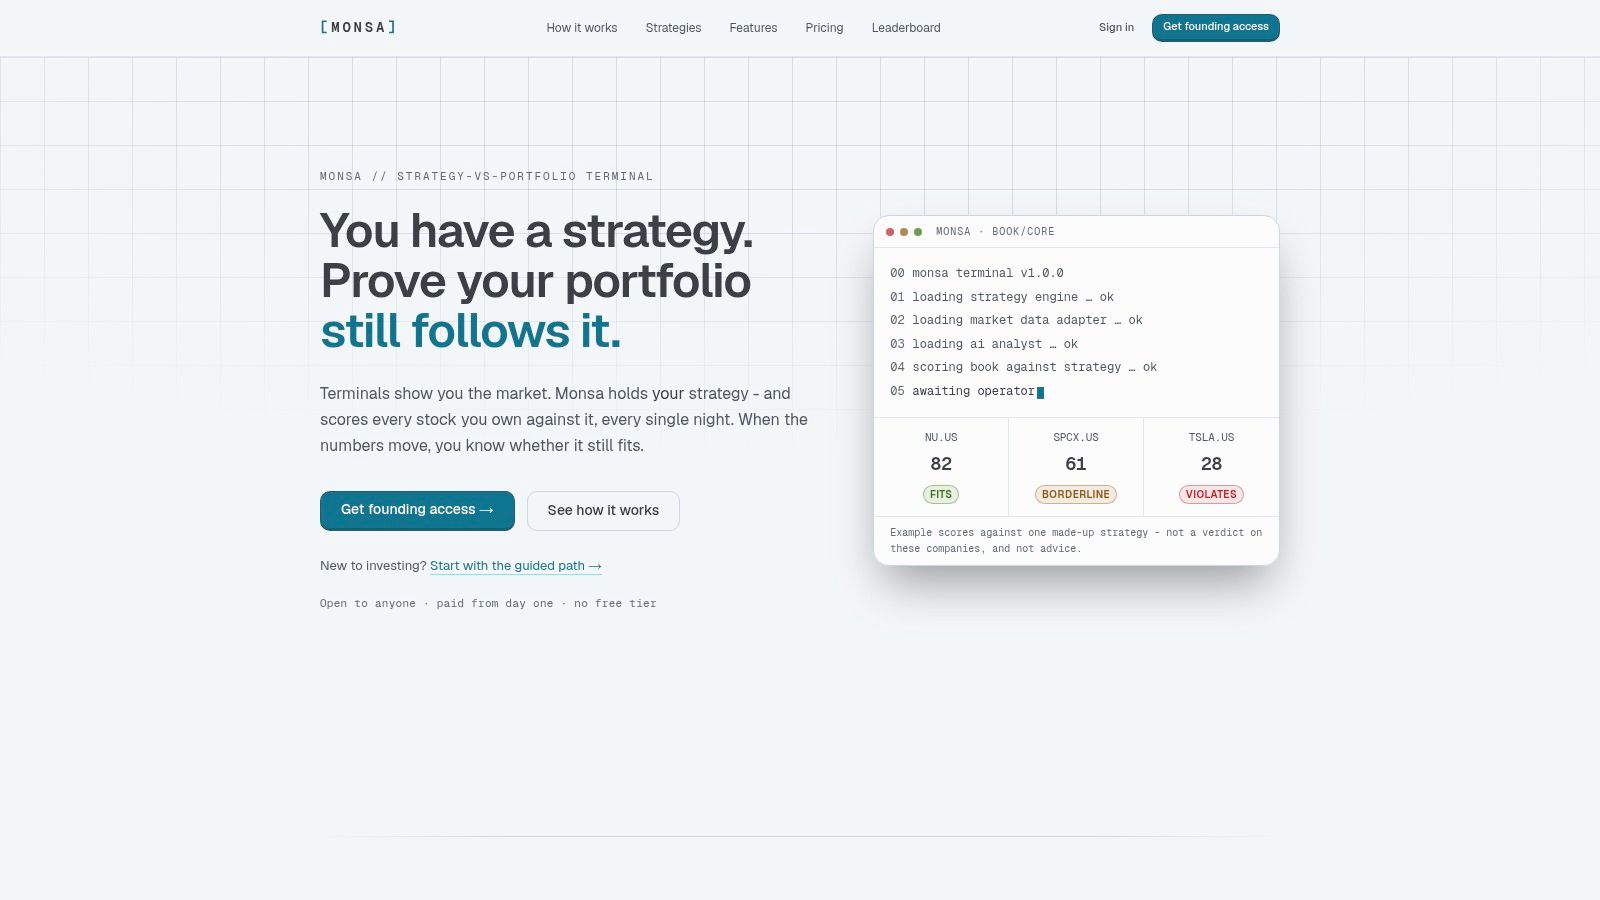
Monsa solves a narrower problem than a screener or charting terminal: does each holding still match the strategy that justified owning it? The workflow starts with a thesis written in plain English or with one of Monsa's published templates. The operator then confirms and adjusts the resulting criteria, turning the written process into checks that can be reviewed against a portfolio.
Each tracked stock receives a score from 0 to 100 and a verdict of fits, borderline, or violates. Results are shown criterion by criterion, which makes the output easier to audit. Numeric checks follow defined calculations. AI handles qualitative judgments only when rules require interpretation, and the reasoning remains visible instead of being reduced to an unexplained signal.
How the workflow works
Monsa refreshes tracked holdings nightly using end-of-day fundamentals, prices, and FX for the United States and major European exchanges, including London, Frankfurt, Amsterdam, and Copenhagen. This follows a documented market-data process in which financial statements, prices, and metrics are collected after the close, indicators are recomputed, and revised scores are published before the next session, as described in Value Markers' data-quality overview.
Operators can select from ten adjustable templates, including GARP, Classic Value, Deep Value, Quality Compounders, Dividend Growth, High Growth, Momentum, Turnaround, Wide Moat, and All-Weather Defensive. Thresholds, weights, tolerance bands, and hard constraints can be edited. The platform also supports natural-language strategy capture, a 34-metric vocabulary, coverage flags for reported, derived, or missing metrics, Claude-powered qualitative analysis, what-would-change notes, and tear-sheets.
Practical rule: A score matters only when the operator can identify the rule behind it and inspect the evidence supporting that rule.
The Matrix view compares every stock with every strategy, helping operators find portfolio-level mismatches. Watch-only tickers receive the same scoring treatment, so a thesis can be tested before a position is added. Portfolio controls include maximum position size, sector caps, minimum and maximum holdings, book value, P&L, drift tracking, and price alerts.
Monsa does not backtest, place trades, or issue advice. It is paid from day one, so operators should check the current Monsa pricing page for access details. Its single-builder model and visible requests board provide a direct roadmap, while also creating a continuity trade-off compared with a larger vendor.
Best for: disciplined long-term equity operators, independent portfolio managers, small RIAs, investment clubs, and thesis-driven creators who need recurring rule checks.
Website: Monsa
2. Stock Rover
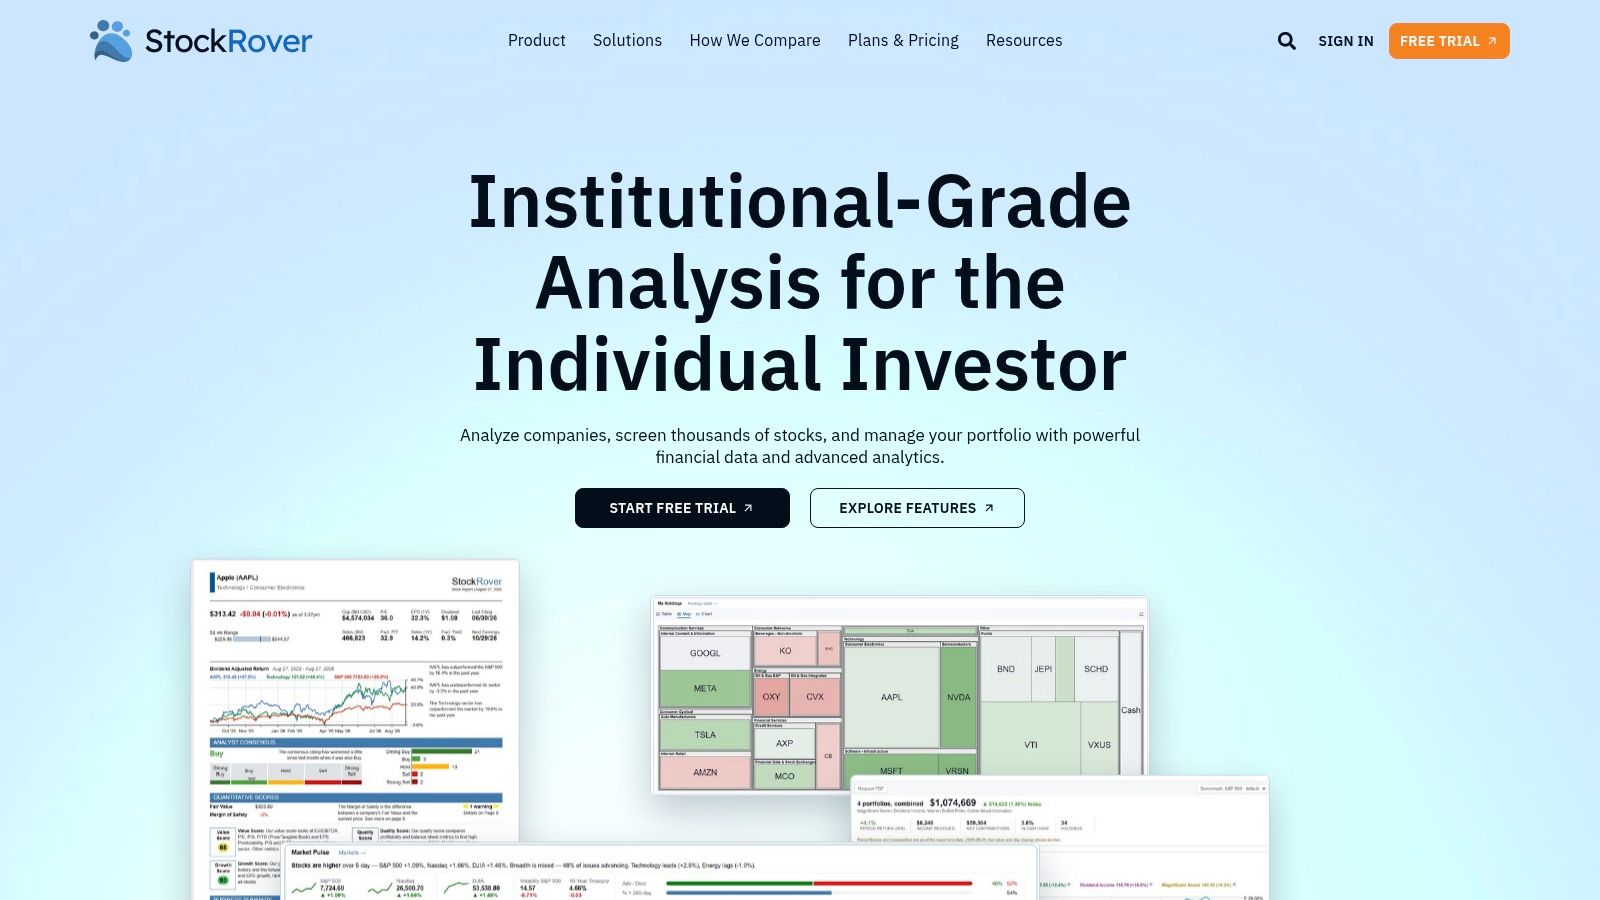
Stock Rover addresses a specific research problem: how to compare companies with detailed fundamental screens, then examine the portfolio built from that work. It fits investors focused on valuation, dividends, financial quality, funds, and long records rather than intraday charting.
According to Stock Rover's official product information, the platform provides more than 800 screening metrics, including equations, percentile comparisons, and historical screening. Its database covers 20 years of fundamentals and 30 years of dividend history. That record allows analysts to test whether a company has matched a defined financial profile across reporting periods, instead of judging it from one current snapshot.
Where it fits in a research stack
Stock Rover also covers approximately 7,400 ETFs and 20,000 mutual funds. Fund-heavy portfolios can connect brokerage accounts and use a multi-page Portfolio Performance Report covering IRR versus TWR, risk views, up/down capture, and fee audits.
The workflow is strongest after an initial screen. An analyst can compare companies, inspect historical fundamentals, review fund exposure, and assess portfolio composition in one environment. Stock Rover supports discovery and portfolio diagnostics. It does not replace a written investment policy that checks whether every holding still satisfies its stated rules.
Stock Rover helps answer, “Which companies meet these financial conditions?” Monsa helps answer, “Do my current holdings still meet the rules I wrote?”
The distinction is useful when choosing between Monsa and Stock Rover's research workflows. Stock Rover is oriented toward the United States and Canada, with more limited data for exchanges outside North America. Its charts support research, but investors seeking a trading-first visual workspace may need another tool.
Best for: fundamentals-driven investors, dividend researchers, value screens, ETF and mutual-fund analysts, and portfolio operators who want detailed reporting.
3. Koyfin
Koyfin addresses a different research problem: understanding market context before evaluating an individual company. Its dashboards combine global equities, ETFs, macroeconomic data, portfolios, news, filings, earnings transcripts, and estimates. The value lies in arranging these inputs around relationships among markets, sectors, currencies, and economic indicators, rather than relying on a single stock score.
Eligible Plus access includes global company snapshots with ten-year financials and estimates, while Premium adds advanced portfolio analytics, according to Koyfin's product pages. Stock and ETF screeners support discovery, and ETF pages show holdings. Premium news, press releases, filings, and earnings transcripts let analysts move from a market view to company materials without repeatedly changing platforms.
Why visual context matters
A company can appear attractive on its own while its sector, currency exposure, or macro setting points to a different research question. Koyfin places sector behavior, cross-asset relationships, macro series, and company financials in customizable dashboards. Higher access includes custom data templates and a formula builder, allowing investors to define layouts suited to their process.
Advisor tiers add client proposals, reports, and custodian integrations. These features extend Koyfin into professional reporting workflows, although advanced analytics and reporting require higher-priced tiers. Mutual-fund data is primarily linked to advisor plans, a relevant constraint for teams researching beyond equities and ETFs.
Koyfin works best as a context and research-navigation layer. It can help identify what changed in a company or market, then direct attention to the relevant evidence. It is not primarily designed to test every holding against an operator's stored rules. That distinction separates visual market research from portfolio oversight, where Monsa compared with Koyfin focuses on whether holdings still match written criteria.
Research distinction: Dashboards improve orientation. They do not automatically create portfolio accountability.
Best for: global equity researchers, macro-aware investors, advisors, and analysts who prefer visual dashboards with customizable formulas.
4. FINVIZ Elite
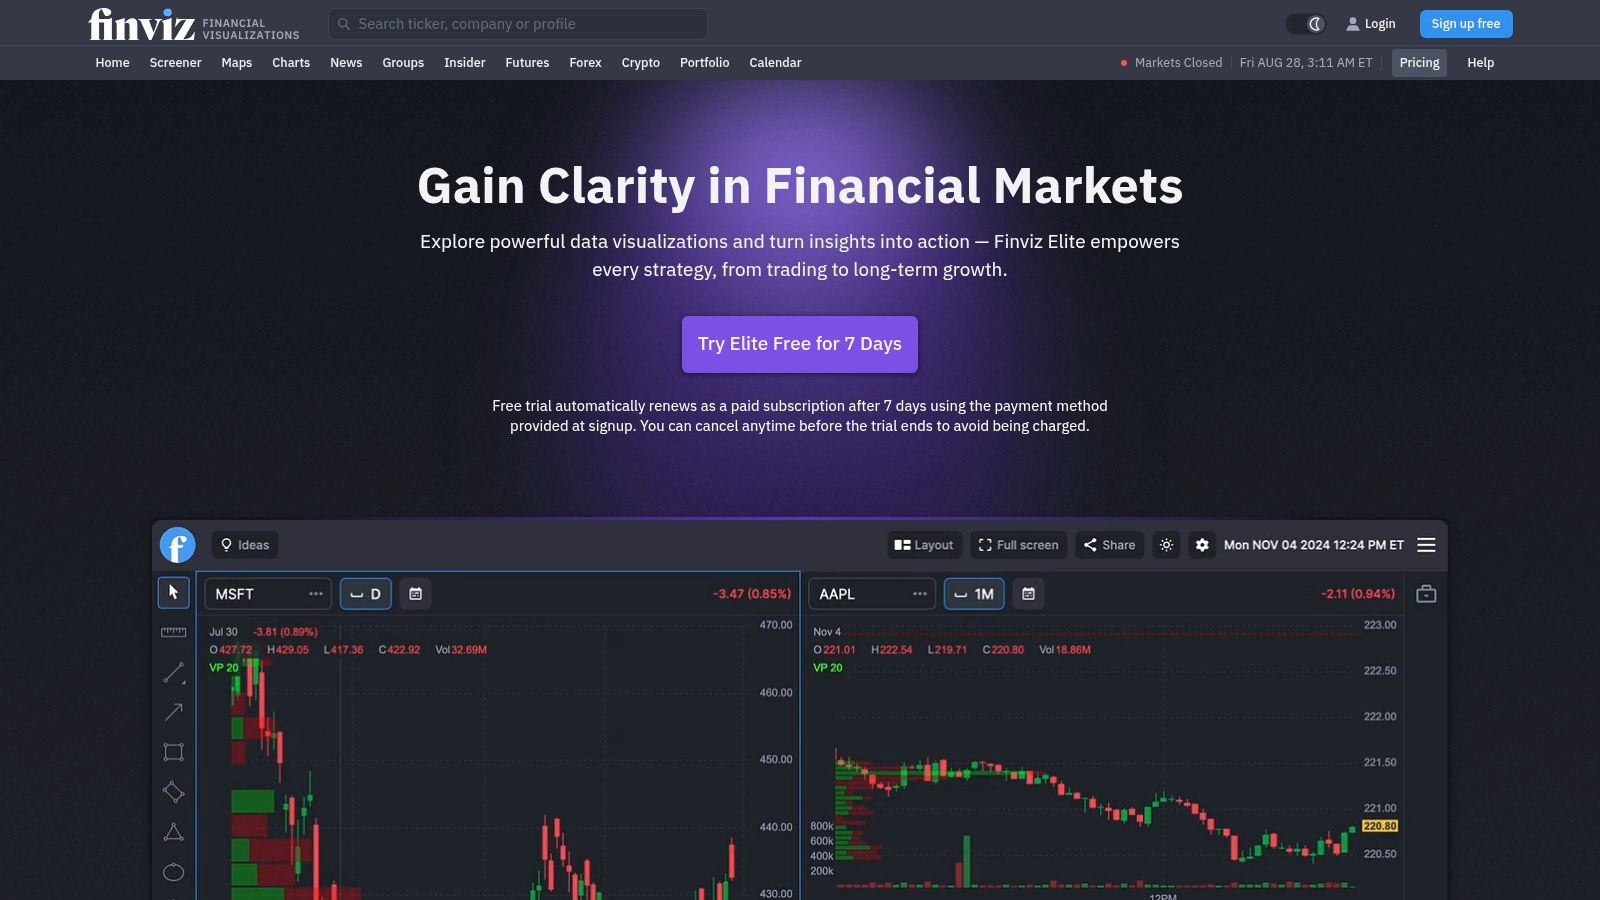
FINVIZ Elite addresses a specific workflow problem: how to screen a U.S. equity universe quickly while monitoring changing market conditions. Its interface prioritizes rapid scanning, visual summaries, alerts, exports, and intraday monitoring over long-form fundamental research.
Elite access provides real-time quotes and charts, including pre-market and after-hours information, according to FINVIZ Elite. Its advanced screener offers more than 20 customizable filters, while presets let analysts repeat a screening routine without rebuilding it. ETF pages add holdings and structural metrics. Alerts and exports support a handoff from idea discovery to a spreadsheet or separate analysis environment.
The advantage is frictionless filtering
FINVIZ fits narrow, time-sensitive research questions. An analyst can combine valuation, technical, sector, and market filters, inspect a visual market map, and build a watchlist without working through a dense fundamental database. That shortens the path from a defined screen to a group of candidates.
The trade-offs matter. Coverage centers on the U.S. market, with limited support for non-U.S. exchanges. Fundamental time series receive less emphasis than on Stock Rover or GuruFocus. FINVIZ can surface companies that meet screening conditions, but it does not store an operator's written thesis or assess whether a holding still meets qualitative rules.
A screener is a funnel, not a portfolio-control system. It narrows attention. The analyst must still determine why a position may conflict with the strategy and record that judgment elsewhere. For this distinction, compare Monsa's strategy-oversight workflow with FINVIZ, which focuses on checking holdings against written rules rather than replacing market screening.
Best for: U.S. equity screening, rapid idea filtering, visual market overviews, intraday monitoring, and export-friendly research.
Website: FINVIZ Elite

5. GuruFocus
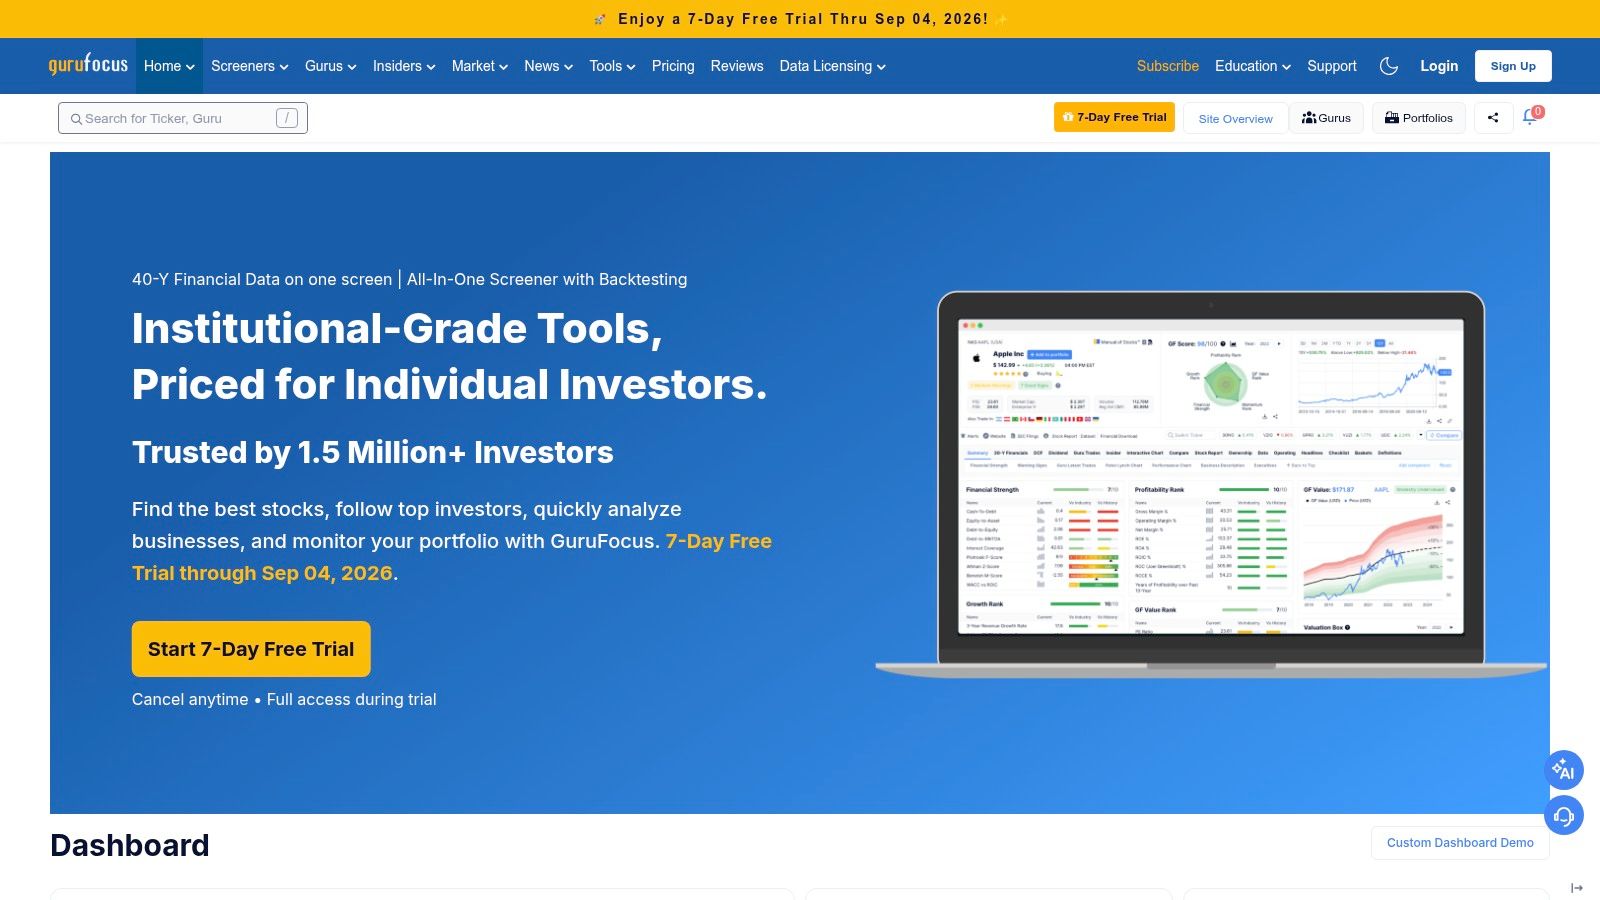
GuruFocus addresses the investor who needs long historical fundamentals, valuation tools, and records of insider and institutional activity. Its dense interface suits forensic research more than rapid idea screening.
The U.S. Premium offering includes 30 years of financial data and valuation calculators such as DCF tools, according to GuruFocus. Its All-in-One Screener, GF Score, GF Value models, insider datasets, institutional holdings, and guru portfolio tracking place several value-research tasks in one environment.
Examining a company's financial history
A recent earnings release or current ratio may not explain how a business reached its present position. GuruFocus lets analysts review long-term changes in margins, capital allocation, debt, valuation, and related fundamentals. Insider and guru tracking adds context, although these datasets still require interpretation and do not replace a documented investment process.
Interactive charts, historical fundamentals, API allowances with eligible subscriptions, and separate data API plans extend the research workflow. Regional access can add cost, so global investors should review the current product structure instead of assuming one plan covers every market.
GuruFocus and Monsa serve different stages of research. GuruFocus can provide historical evidence for a thesis. Monsa can turn that thesis into checkable rules and flag when tracked holdings move outside them. One supports company research, while the other supports oversight of whether a portfolio still follows its written strategy.
Best for: value investors, fundamental analysts, researchers studying long-term financial history, and operators tracking insider or institutional ownership.
Strength: deep fundamental context and valuation tooling.
Constraint: the interface can feel crowded, and regional expansion adds complexity for investors needing broad international coverage.
6. Morningstar Investor
Morningstar Investor addresses a different research problem: finding structured analyst research across stocks, ETFs, and mutual funds. Its workflow combines analyst reports, star ratings, moat assessments, fair value estimates, portfolio tools, alerts, newsletters, and Stock Analyst Notes.
The platform gives investors a consistent vocabulary for competitive advantage, stewardship, valuation, risk, and fees. That framework is useful for comparing securities and funds without building every conclusion from raw financial statements. Its screeners and portfolio tools help organize that research, while the primary work remains reading and interpreting analyst judgment.
Analyst research versus personal rules
Morningstar's moat and fair-value analysis can serve as a qualitative reference point for long-term research. Coverage of funds and ETFs also fits mixed portfolios, whereas some competing tools focus more narrowly on individual stocks.
Customization is the main trade-off. Investors seeking extensive quantitative filters or rule-by-rule portfolio checks may find the workflow less flexible. Access requires a subscription, so investors should review the current pricing page before committing.
Morningstar and Monsa answer separate questions. Morningstar evaluates a company or fund through its own research methodology. Monsa checks whether tracked holdings still match the operator's written framework. Used together, Morningstar can inform the investment thesis, while Monsa can identify when a holding no longer satisfies the rules attached to that thesis.
Best for: long-term researchers who value analyst reports, fund and ETF coverage, moat analysis, valuation context, and fee awareness.
Strength: a recognizable, methodology-led research framework.
Constraint: less flexible for highly customized quantitative screening or rule-based portfolio oversight.
Website: Morningstar Investor
7. Seeking Alpha Premium
Seeking Alpha Premium serves investors who need to compare quantitative signals with human-authored equity research. Its workflow brings together Quant Ratings, factor grades, stock and ETF screeners, contributor analysis, earnings-call insights, transcripts, portfolio monitoring, and Virtual Analyst summaries.
The platform addresses a research problem that single-score tools handle poorly: competing interpretations. An investor can review a company's factor profile, compare contributors' arguments, inspect an earnings transcript, and monitor new coverage or alerts in one workspace. That combination makes Seeking Alpha a research and idea-discovery hub, rather than a pure market-data terminal.
Research breadth requires editorial judgment
Coverage volume is useful only when the reader can separate evidence from assumptions and narrative. Contributor quality and perspective vary, while quantitative grades organize attention without encoding the exact rules of an individual portfolio. The investor still has to decide which claims deserve further verification and which risks could invalidate the thesis.
Seeking Alpha therefore fits best in the interpretation stage of a research process. Transcripts, estimates, factor data, and written analysis can refresh or challenge an investment thesis. They do not replace a written buy case, a defined sell rule, or a separate check on whether current holdings still meet those conditions.
Monsa serves that oversight function. It checks whether tracked holdings continue to match the operator's stated criteria, so the research platform and the portfolio-control layer answer different questions.
The investment-research software market is also moving toward integrated analytics and automation. An estimate projects growth from USD 388.64 million in 2026 to USD 895.75 million by 2035, at a 9.5% compound annual growth rate, according to Market Growth Reports' investment research software estimate. The trend supports a clearer division between discovery, interpretation, and oversight. No individual rating becomes authoritative merely because it appears inside a broader platform.
Best for: investors seeking quantitative filtering, contributor perspectives, transcripts, and active idea discovery.
Strength: broad access to data, commentary, and earnings materials.
Constraint: content volume can overwhelm an investment process, while personal rule adherence requires another layer.
Website: Seeking Alpha Premium
Top 7 Stock Analysis Tools Comparison
| Product | Implementation complexity 🔄 | Resource requirements ⚡ | Expected outcomes ⭐ / 📊 | Ideal use cases 💡 | Key advantages |
|---|---|---|---|---|---|
| Monsa | 🔄 Moderate, write/tune NL rules and templates; nightly automation | ⚡ Paid from day one; subscription-based access with multiple portfolio and ticker tracking; US + major EU EOD data | ⭐ High, enforces discipline with nightly 0–100 fit scores and per‑criterion breakdowns (📊 clear violations/fit signals) | 💡 Long‑term stock pickers, small RIAs, thesis‑driven investors needing auditability | Transparent NL strategy capture, deterministic + AI scoring, matrix view, watch‑only vetting |
| Stock Rover | 🔄 Moderate, deep screening setup and report configuration | ⚡ Subscription; extensive data (800+ metrics, 20 years fundamentals, fund coverage); brokerage sync available | ⭐ High, rigorous fundamental screening and multi‑page portfolio diagnostics (📊 IRR/TWR, risk, fee audits) | 💡 Dividend/value investors, fund/ETF analysis, retail advisors needing fundamentals depth | Exceptional fundamentals depth, detailed portfolio analytics, brokerage integration |
| Koyfin | 🔄 Moderate, quick to use dashboards; advanced features require learning | ⚡ Tiered subscription (Plus/Premium/Advisor) for advanced analytics and templates; global coverage | ⭐ High, fast visual market context and cross‑asset analytics (📊 dashboards & reports) | 💡 Advisors and macro‑aware investors needing visual dashboards and advisor reporting | Fast visual dashboards, transcripts/filings workflow, global equity + macro coverage |
| FINVIZ Elite | 🔄 Low, immediate setup, speed‑first UI | ⚡ Affordable real‑time tier; US market focus; exports and alerts included | ⭐ Medium, fast idea generation and intraday monitoring (📊 rapid screening results) | 💡 Active traders and scanners needing quick filters, intraday alerts and exports | Fast screening interface, real‑time quotes, alerts and export/API samples |
| GuruFocus | 🔄 Moderate, many forensic/value tools to learn and apply | ⚡ Mid‑tier subscription; deep historical data (30 years on some plans); optional API/add‑ons | ⭐ High, strong value/quality signals and long‑history forensic metrics (📊 GF Score, DCF outputs) | 💡 Value investors, guru/insider trackers, forensic fundamental research | Proprietary GF scores, DCF calculators, insider/guru holdings, long historical series |
| Morningstar Investor | 🔄 Low, straightforward use of analyst research and screeners | ⚡ Subscriber access to analyst reports and fair‑value/moat data; paid tier only | ⭐ Medium, trusted analyst frameworks and vetted research (📊 fair‑value and stewardship context) | 💡 Long‑term investors seeking vetted research on stocks, ETFs and mutual funds | Analyst reports, moat/fair‑value assessments, balanced fund & stock coverage |
| Seeking Alpha Premium | 🔄 Low–Moderate, easy platform but content can be dense | ⚡ Subscription; broad crowdsourced + quant content and transcripts | ⭐ Medium, strong idea discovery and catalyst tracking; quant + human signals (📊 quant grades + community insights) | 💡 Idea discovery, earnings/transcript insights, complements rules‑based tools | Quant Ratings, extensive contributor coverage, transcripts, AI summaries and alerts |
Build a Research Stack That Matches Your Rules
The best stock analysis tools aren't ranked meaningfully by feature count alone. They're useful when their core workflow matches the question an investor needs to answer. A platform that excels at charting may be inefficient for historical financial research. A deep screener may identify candidates but leave the operator without a reliable way to monitor thesis drift after ownership begins.
Choose Stock Rover or GuruFocus when fundamental history is the central requirement. Stock Rover is particularly suited to detailed screening, dividend research, fund analysis, and portfolio diagnostics. GuruFocus is better aligned with value-oriented research that depends on long financial histories, valuation models, insider activity, and guru or institutional tracking.
Choose FINVIZ Elite for rapid U.S. equity filtering and visual market monitoring. It's a practical front-end for idea generation when speed, alerts, exports, and intraday data matter more than deep fundamental time series. Choose Koyfin when global visual context, macro relationships, custom dashboards, filings, and earnings transcripts need to sit in the same workspace.
Choose Morningstar Investor for structured analyst research across stocks, ETFs, and mutual funds. Its moat, valuation, risk, and fee frameworks suit readers who want an established research lens. Choose Seeking Alpha Premium when the process benefits from quantitative factor grades, human-authored analysis, transcripts, and a broad stream of company-specific commentary.
Monsa belongs in a different category. It's the oversight layer for operators whose central question is whether current holdings still match written criteria. That gap is significant because recent coverage says very few tools connect research, portfolio construction, and ongoing performance monitoring into one coherent experience, as discussed by Top Tier Strategy's 2026 stock-tool analysis.
Before choosing a combination, compare exchange coverage, data depth, customization, portfolio workflow, qualitative judgment, integration, and current pricing. Also ask whether the product helps you repeat your process or merely gives you more information. Research adoption is moving toward AI-assisted workflows, with 78.3% of respondents reporting AI adoption for investment research, while 65.1% planned to replace parts of manual research with AI within a year, according to the Bridgewise State of AI for Wealth report. The useful question isn't whether a tool sounds intelligent. It's whether the rules, evidence, and reasoning remain inspectable.
Monsa stores an operator's strategy, scores each tracked stock against its written criteria, and refreshes the verdict nightly using fundamentals, prices, and FX. To add a strategy-versus-portfolio oversight layer to your research stack, visit Monsa and review how its transparent fit scores, verdicts, and rule breakdowns support ongoing thesis checks.
Monsa is a portfolio-analysis tool, not a broker or investment adviser. Nothing here is investment advice.
// related reading
What Is Portfolio Turnover and Why It Matters
What is portfolio turnover? Learn the SEC formula, worked examples, costs, taxes and benchmarks to judge if trading fits your strategy.
Watchlist Management: A Step-by-Step Guide for Traders
Master watchlist management with actionable steps to create, score, and prioritize your stock list. Learn thesis alignment and alerts setup for better
Florida Unemployment Amount: What You Will Actually Receive
Learn how the Florida unemployment amount is calculated, the $275 weekly cap, duration rules, and how partial earnings change your payment in 2026.
7 / 100 founding seats claimed - $100/yr locked, then $190/yr
Monsa is a portfolio-analysis tool, not a broker or investment adviser. It never recommends what to buy or sell - it checks what you hold against rules you wrote. Nothing here is investment advice.