// blog
Portfolio Drift: A 2026 Guide for Equity Operators
You wrote a strategy at the start of the year. It specified the type of companies you wanted to own, the role each position should play, and the conditions that would invalidate the thesis. Six months later, the portfolio still looks familiar in the account view, but the structure has changed. One group now dominates the book, smaller positions have faded, and cash is doing less work than intended. No single trade explains the difference.
That's portfolio drift. It isn't automatically a failure, and it isn't a signal to trade by itself. It's a measurable gap between what the portfolio is and what the operator intended it to be. The analytical task is to identify which gap exists, why it exists, and whether correcting it is worth the fees, taxes, turnover, and operational effort.
Table of Contents
- When Your Portfolio Stops Looking Like Your Plan
- Intent and execution are different records
- What Portfolio Drift Means
- Weight drift and thesis drift are separate control problems
- The Main Forces That Push a Book Off Course
- Why calendar reviews can arrive late
- Measuring Drift the Right Way
- Portfolio-level measures compress the detail
- Rebalancing Methods Compared
- Beyond Weights Toward Constraints and Alerts
- Alerts answer a different question
- A Practical Mitigation Stack for Operators
- Start with the written policy
- Encode mechanical limits
- Add alerts, then add meaning
- Building a Discipline Loop That Lasts
- Keep the audit trail clean
When Your Portfolio Stops Looking Like Your Plan
A stock-picker writes a year-end thesis with a clear allocation: 60 percent large-cap quality, 25 percent mid-cap growth, and 15 percent cash. The plan reflects a deliberate balance between established businesses, higher-growth holdings, and liquidity for flexibility.
Six months later, the blotter tells a different story. Mega-cap momentum names now occupy much of the equity sleeve. Mid-cap exposure has fallen to roughly half its intended level, while cash is near 3 percent. The operator didn't knowingly increase the dominant names. No thesis was formally abandoned. The portfolio changed because relative price moves, subscriptions, withdrawals, dividends, and corporate actions altered the book between reviews.
The confusion is practical, not philosophical. Which position caused the change? Was the allocation shift deliberate enough to keep? Does the smaller mid-cap sleeve still express the original idea? Is the cash reduction a mechanical consequence of activity or a breach of policy?
Intent and execution are different records
The account statement records holdings. The strategy document records intent. Portfolio drift appears when those records stop agreeing.
Classical allocation drift compares current weights with target weights. The definition of portfolio drift and threshold rebalancing describes it as the gap between actual and intended weights, with threshold rules used to identify when action may be required. That measurement can reveal an exposure problem even when every individual holding still appears familiar.
A second problem is less visible. A position can remain within its weight range while no longer satisfying the written thesis. Its valuation may have moved beyond the strategy's tolerance, its catalyst may have expired, or its risk profile may have changed. The position hasn't necessarily drifted in weight, but it may have drifted in purpose.
Operating principle: Measure the distance from the allocation plan and the distance from the written thesis. Neither view is sufficient on its own.
The rest of the process follows that dual lens. Weight drift asks whether the book still matches target exposures. Thesis drift asks whether each holding still belongs under the rules that justified it. For strategy-aware operators, both deserve nightly attention, because a calendar review can miss a meaningful change that happened yesterday.
What Portfolio Drift Means
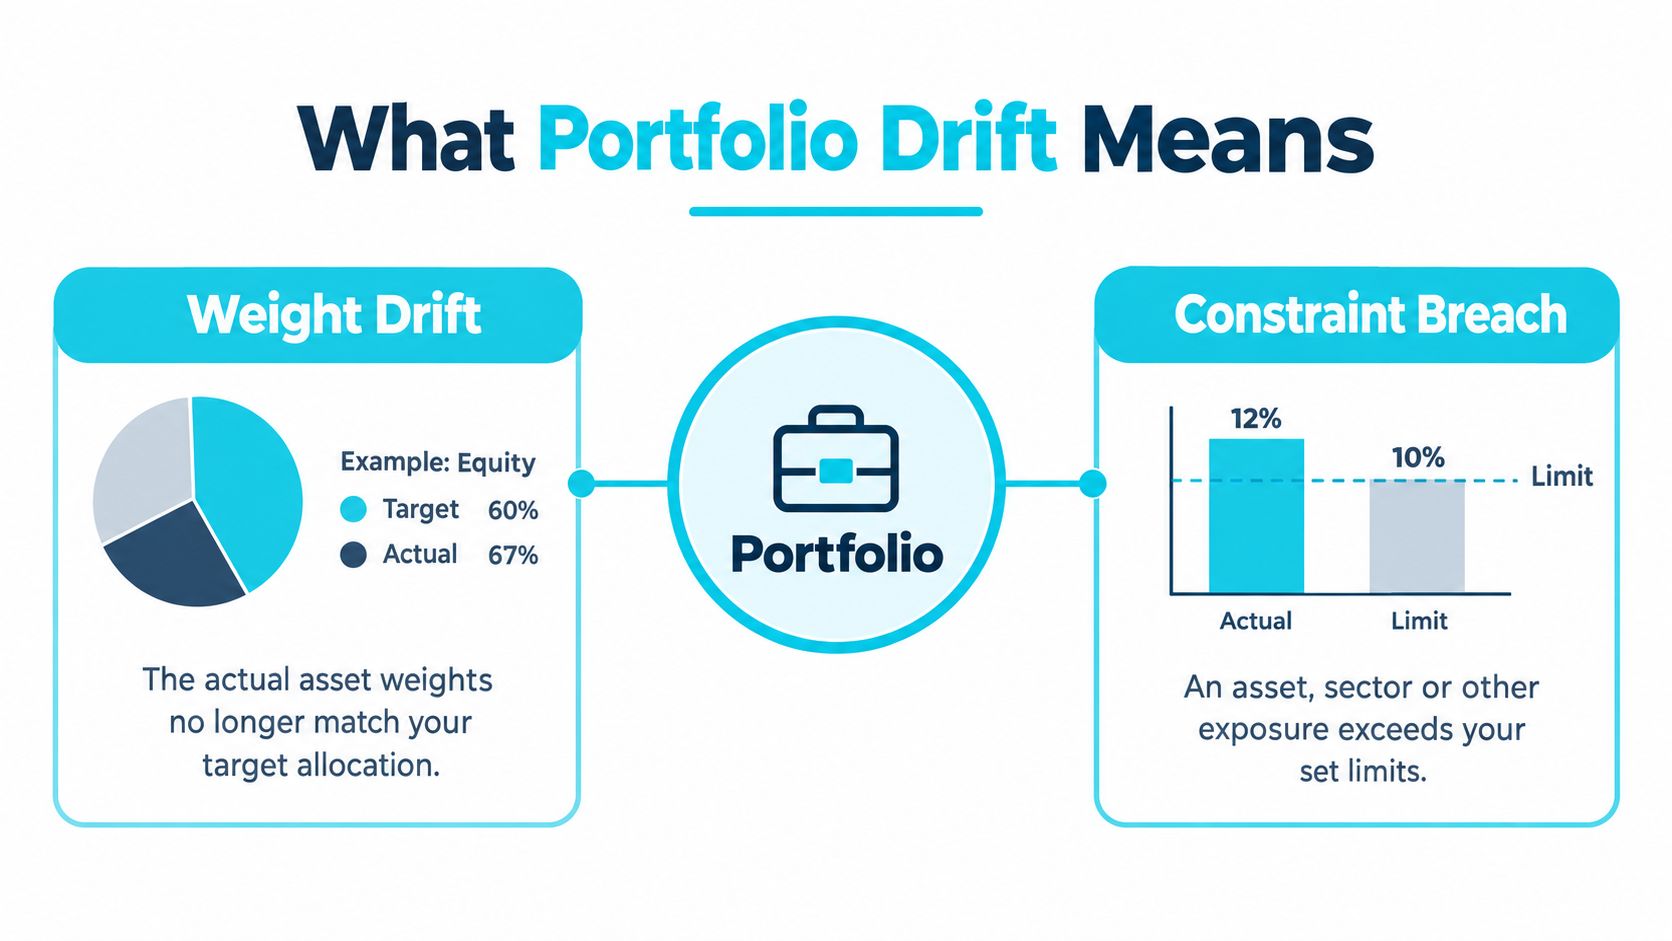
Portfolio drift is the gap between a portfolio's current state and its intended state. That intention can be defined by asset weights, sector limits, factor exposures, cash requirements, position sizes, or the written reason for owning each security. A portfolio can therefore comply with its headline allocation while violating a less visible rule.
The classical form is weight drift. An operator compares actual exposure with target exposure across the dimensions relevant to the mandate, including broad sleeves, sectors, factors, and individual positions. A position targeted at 10 percent but held at 13 percent shows a positive deviation of three percentage points. A cash target of 15 percent with an actual weight of 8 percent shows a negative deviation of seven percentage points.
The second form is thesis drift. A holding may remain inside its permitted weight range while the conditions supporting ownership change. The written strategy may require a particular growth profile, balance-sheet quality, time horizon, catalyst, or risk view. If company facts change faster than the strategy record, the position remains numerically compliant but becomes strategically misaligned.
Weight drift and thesis drift are separate control problems
The difference resembles a cookbook in which the measurements remain correct but the ingredients no longer match the intended dish. Weight drift changes the quantities. One exposure becomes too large, another too small, and the proportions move away from the plan even if every holding remains familiar.
Thesis drift changes the fit between a holding and the strategy. The position may have a reasonable size, yet its role, rationale, or eligibility is no longer clear. Its catalyst may have expired, its risk profile may have changed, or its original investment condition may no longer hold.
Stable weights can therefore create false comfort. A position-level monitor may show every holding inside its band while missing a broken thesis. Strategy-aware operators keep two linked records: a numerical exposure record and a strategy record explaining why each holding remains present. Both should be reviewed nightly, because a calendar rebalance can correct an allocation gap while leaving the underlying thesis mismatch untouched.
The Main Forces That Push a Book Off Course
Drift rarely begins with a single dramatic decision. It usually emerges from ordinary portfolio activity interacting with unequal price movements.
Broad market moves change relative weights whenever sleeves respond differently to the same environment. A defensive allocation can become larger relative to equities during a risk-off period, while an equity sleeve can dominate during a sustained rally. The operator may make no trade, yet the allocation changes because the components move at different rates.
Idiosyncratic price action operates at the position level. An earnings announcement, guidance revision, acquisition rumor, or company-specific setback can move one name far more than the rest of the book. The thesis might remain intact, but the position can cross its target range before the next scheduled review.
Capital flows create mechanical changes. Contributions, withdrawals, dividends, and coupons alter the denominator or add cash to the account. If the operator doesn't direct those flows according to a stated policy, the portfolio can move away from its intended structure without a new security trade.
Corporate actions can rewrite the holdings map. Splits, spin-offs, mergers, and special dividends may create new identifiers, change share counts, distribute cash, or transform one position into several exposures. A monitor that only checks trade activity can miss the economic change.
| Driver | Mechanism | Typical Time Horizon |
|---|---|---|
| Broad market moves | Unequal movement across sleeves changes relative weights | Gradual or sudden |
| Idiosyncratic price action | A company-specific event shifts one position | Immediate |
| Capital flows | Contributions, withdrawals, dividends, and coupons reshape the denominator | Ongoing |
| Corporate actions | Splits, spin-offs, mergers, and special dividends alter holdings and cash | Event-driven |
Why calendar reviews can arrive late
These forces compound between rebalance dates. A fixed review can identify the final result, but not necessarily the sequence that produced it. That distinction affects the operator's response because an allocation shift caused by cash flows has a different operational remedy from one caused by a thesis-breaking event.
The evidence also shows why frequency needs context. In a 29-year study of a 60/40 global stock and U.S. bond portfolio from April 1996 to December 2024, a never-rebalanced portfolio had 12.6 percent average drift, while a quarterly rebalanced version averaged 1.3 percent drift. The study found that more frequent rebalancing generally reduced drift over time, but control came with more trading activity and associated costs. The study's results are available here.
Nightly monitoring doesn't mean nightly trading. It means the operator sees the change when it happens, classifies its source, and decides whether the deviation is explainable or requires review.
Measuring Drift the Right Way
Start with a deviation matrix rather than a chart. Suppose a three-position book has target weights of 60 percent, 30 percent, and 10 percent. One position rises to 15 percentage points above its target, while the other positions are adjusted only enough to keep the portfolio total intact.
| Position | Target Weight | Actual Weight | Deviation |
|---|---|---|---|
| Position A | 60% | 75% | +15 percentage points |
| Position B | 30% | 20% | -10 percentage points |
| Position C | 10% | 5% | -5 percentage points |
Add a plus or minus 5 percentage point tolerance band around each target. Position A is outside its permitted range. Position B is outside its range. Position C sits at the lower boundary. The table doesn't tell the operator whether to trade. It tells the operator exactly where the book no longer follows its allocation rule.
Portfolio-level measures compress the detail
At the portfolio level, active share aggregates position differences into a measure of how unlike the current book is from its reference portfolio. Tracking error summarizes how differently the portfolio has behaved relative to that reference over time. Both can be useful summaries, but neither identifies the cause of a breach or explains whether a holding still fits the strategy.
The operational sequence should be:
1. Calculate actual weights: Use current market values and the correct portfolio denominator. 2. Compare with targets: Record deviations in percentage points, not just visual changes. 3. Apply limits: Mark each position, sleeve, sector, or factor as inside, near, or outside its band. 4. Trace the cause: Separate market movement, cash flow, corporate action, and deliberate activity. 5. Review the thesis: Check whether the written rationale still matches current facts.
Thesis drift needs a different record. Score each holding against the original write-up across pillars such as time horizon, catalyst, business quality, valuation logic, and risk view. A name may pass the weight test and fail the thesis test. Another may exceed a weight band while the thesis remains fully intact, creating a sizing issue rather than an eligibility issue.
| Dimension | Weight Drift | Thesis Drift |
|---|---|---|
| Primary question | Does actual exposure match target exposure? | Does the holding still match the written strategy? |
| Evidence | Market value, position size, sector and factor exposure | Fundamentals, catalyst, horizon, risk view, and rule fit |
| Trigger | A numerical band or constraint is crossed | A strategic criterion changes or becomes unsupported |
| Output | In-range, near-limit, or breach | Fits, borderline, or violates |
| Review frequency | After price, flow, or corporate-action changes | Whenever relevant facts or assumptions change |
A weight-only monitor sees the first category. A strategy-aware check runs against both categories nightly, showing operators what moved and why it matters.
Rebalancing Methods Compared
Rebalancing is a control mechanism, not a market forecast. The method determines when the operator reviews a deviation, how often trades may occur, and how much activity the process creates.
Calendar rebalancing uses fixed dates. It's simple to schedule, easy to document, and predictable for operations. Its weakness is the gap between review dates. A large exposure change can occur immediately after one session and remain unseen until the next scheduled checkpoint.
Threshold rebalancing acts when a weight leaves a preset band. For example, a 60 percent stock target with a plus or minus 5 percentage point band creates an acceptable range from 55 percent to 65 percent, as illustrated in this explanation of threshold rebalancing. The method responds to the size of the deviation rather than the calendar, but volatile periods can produce clustered reviews and trades.
Tolerance-band rebalancing adds structure between those approaches. A soft band can trigger investigation, while a hard band requires formal escalation. Small deviations remain visible without creating immediate turnover, while larger gaps receive priority.
| Method | Cadence | Cost Profile | Responsiveness | Best Fit |
|---|---|---|---|---|
| Calendar | Fixed review dates | Predictable, but may create scheduled turnover | Low between dates | Long-only mandates with stable operating routines |
| Threshold | Event-driven when a band is breached | Variable and potentially clustered | High for numerical drift | Higher-turnover strategies with explicit limits |
| Tolerance band | Continuous monitoring with soft and hard tiers | Moderates small activity while preserving escalation | Balanced | Thesis-driven books requiring review before execution |
The evidence favors examining cost alongside control. A 2025 analysis found 12.6 percent average drift in a never-rebalanced case, compared with 3.2 percent for annual rebalancing and 3.8 percent for a 5 percent threshold rule. The comparative research is available here. Another analysis reported that quarterly rebalancing reduced average drift to 1.3 percent, but the improvement from annual to quarterly rebalancing was small relative to the threefold increase in transaction frequency and costs. See the discussion of optimal rebalancing strategy.
For a deeper implementation view, compare the portfolio rebalancing tool. The practical decision is whether a deviation is large enough, meaningful enough, and strategically relevant enough to justify action after costs and taxes.
Beyond Weights Toward Constraints and Alerts
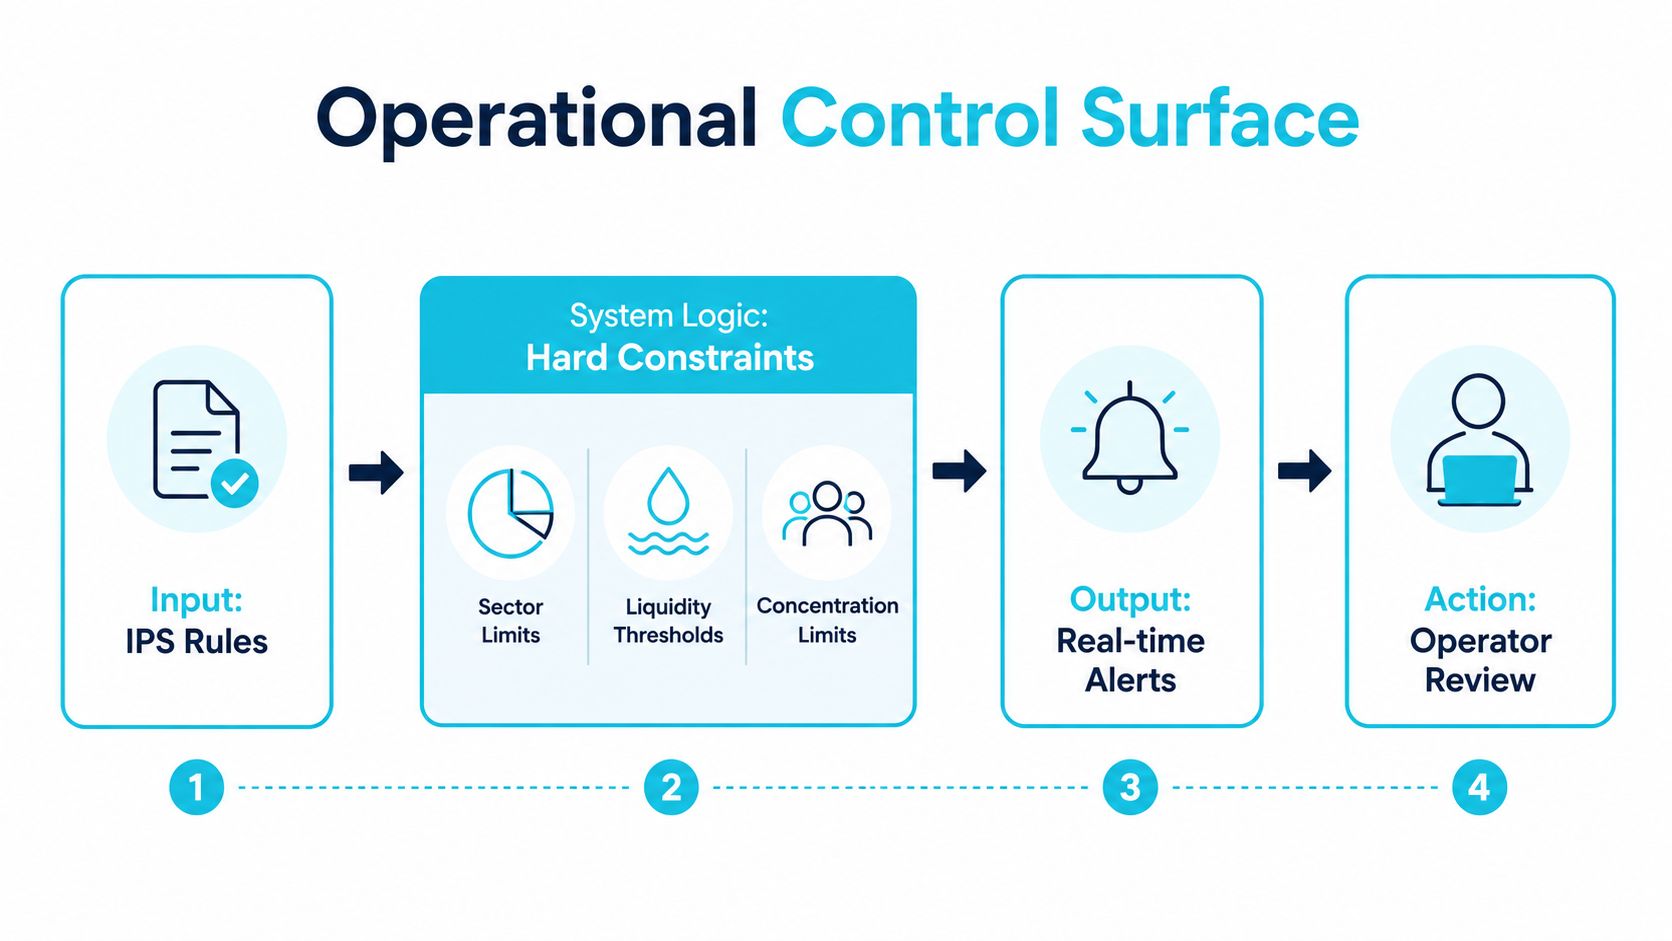
A portfolio can remain close to its target weights and still violate the rules that define its risk budget. Operators need a control surface that translates the investment policy statement into enforceable conditions.
Useful constraints include:
- Sector caps: Limit concentration in a single industry group.
- Single-name limits: Prevent one holding from dominating the book.
- Factor exposures: Monitor characteristics such as size, quality, momentum, or sensitivity to rates.
- Liquidity floors: Preserve the ability to execute or meet withdrawals.
- Cash buffers: Keep the intended reserve available for the mandate.
Each constraint needs a numeric guardrail, an owner, and a documented response. A limit without an owner becomes a dashboard decoration. A limit with no action template forces the operator to improvise under pressure.
Alerts answer a different question
Constraints answer, “Are we within limits?” Alerts answer, “Is something about to break?” A two-tier design can place a warning at 80 percent of a limit and a breach at 100 percent, with each message routed to a named recipient and linked to an action template. The thresholds are process choices, not universal standards. Their value comes from consistency and ownership.
A nightly workflow might follow this sequence:
1. Pull settled positions, cash, corporate-action updates, and relevant market data. 2. Recompute position, sector, factor, liquidity, and cash exposures. 3. Compare each value with its guardrails. 4. Score each holding against its written thesis. 5. Produce one drift summary before the open. 6. Route warnings and breaches to the responsible operator.
The result shouldn't be an undifferentiated stream of notifications. It should tell the desk what moved, which rule is affected, whether the issue is numerical or strategic, and what evidence supports the flag.
For implementation details, see the portfolio monitoring tool guide. The system earns trust when it catches ordinary changes reliably, distinguishes a warning from a breach, and leaves a review record after the operator makes a decision.
A Practical Mitigation Stack for Operators
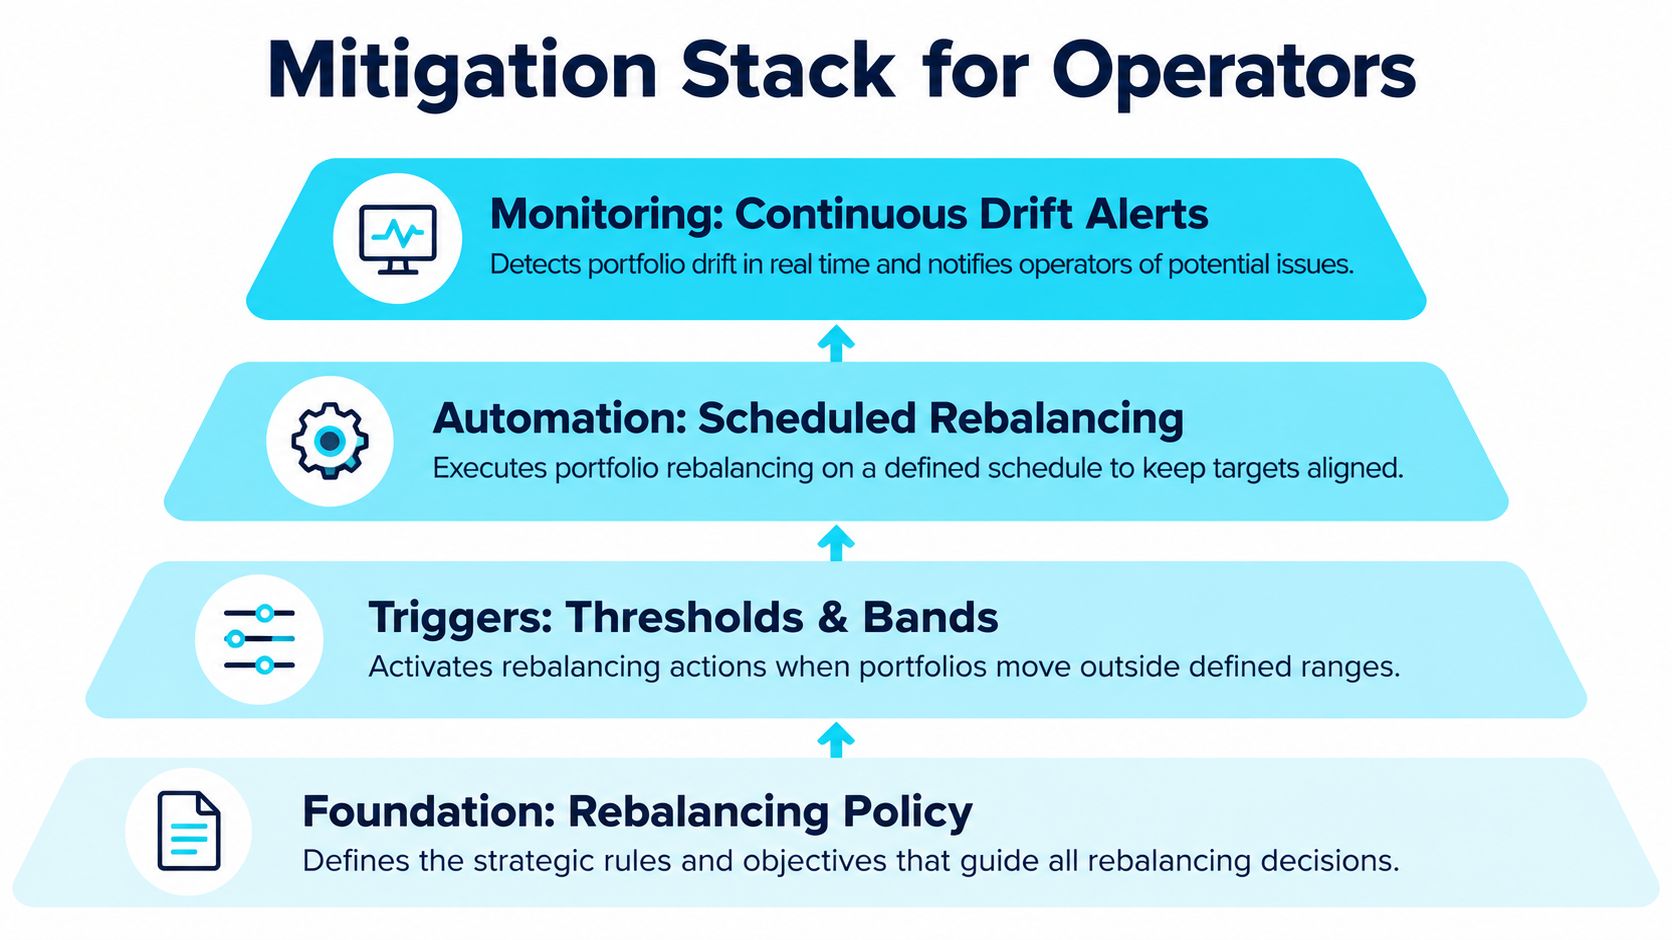
Drift control works better as a layered operating system than as a single rebalance button. Build the layers in an order that makes the policy explicit before adding automation.
Start with the written policy
The foundation is a rebalancing policy that states the trigger type, tolerance bands, review owner, execution rules, and exception process. It should also explain how the operator handles contributions, withdrawals, dividends, coupons, and corporate actions.
An undocumented policy depends on memory. Under pressure, memory becomes selective. A written policy makes the intended response visible before an alert arrives.
Encode mechanical limits
Next, place hard constraints in the order management system. Maximum position weight, sector caps, cash requirements, and factor limits can prevent an order from creating a known breach. The system doesn't need to judge the thesis to reject a trade that violates a mechanical rule.
The portfolio optimization constraints guide provides a useful reference point for expressing these restrictions formally. The important operational distinction is between a rule that blocks activity and an alert that merely reports it.
Add alerts, then add meaning
The alert layer should cover nightly position-versus-thesis checks, weight breaches, concentration warnings, and stale data. Route the messages to a dashboard or messaging channel where the named operator can acknowledge them.
The top layer is the strategy template. Link every holding to a thesis, time horizon, key criteria, and exit conditions. That context turns a weight alert into an interpretable event. A position that exceeds its range may need a sizing review. A position that fails a core thesis rule may need a strategy review. The numbers identify the location of drift, while the template explains its significance.
The layers reinforce one another:
- Policy sets intent: It defines what alignment means.
- Constraints prevent mechanical breaches: They stop known violations at order entry.
- Alerts expose exceptions: They identify changes that occur outside planned activity.
- Templates preserve meaning: They connect each holding to the rules that justify its place.
No layer replaces the others. A constraint can't detect a stale thesis, and a thesis template can't prevent an accidental concentration increase without a mechanical limit.
Building a Discipline Loop That Lasts
Drift control fails when it's treated as a one-time cleanup. The portfolio returns to the same operating environment after every review, so the process needs a repeatable loop with an audit trail.
A weekly operator checklist can close that loop:
1. Review overnight alerts: Separate new events from unresolved exceptions. 2. Triage by severity and source: Distinguish a hard constraint breach from ordinary price movement or stale documentation. 3. Document the decision: Record the selected action or the deliberate decision to hold. 4. Verify the strategy: Confirm that the written thesis still reflects the current mandate. 5. Update only genuine changes: Adjust thresholds when the strategy has evolved, not because one alert is inconvenient. 6. Confirm data quality: Check that positions, prices, fundamentals, FX, and corporate actions are current.
The point isn't zero drift. A live portfolio will move. The target is bounded, explainable drift, where every deviation can be traced to market movement, deliberate reallocation, capital flow, corporate action, or a thesis document that has become stale.
Keep the audit trail clean
A disciplined loop starts each cycle with known exceptions. The operator can see which alerts were reviewed, which constraints changed, and which holdings require a thesis update. That record prevents the same unresolved question from appearing repeatedly without an owner.
The common failure mode is different. An alert arrives, the operator postpones it, and the next cycle contains a larger deviation with less context. The portfolio may still look acceptable in aggregate, but nobody can explain how it reached that state.
The durable advantage is procedural: a simple checklist followed every cycle is more dependable than an elaborate system that operators bypass when markets become difficult.
Monsa gives operators a strategy-versus-portfolio terminal that stores written rules, scores each tracked stock against those rules, and refreshes the verdict nightly using fundamentals, prices, and FX. To monitor both allocation and thesis alignment in one workflow, visit Monsa and review how its fit scores, rule breakdowns, and portfolio drift view can support your operating process.
Monsa is a portfolio-analysis tool, not a broker or investment adviser. Nothing here is investment advice.
// related reading
What Is Portfolio Turnover and Why It Matters
What is portfolio turnover? Learn the SEC formula, worked examples, costs, taxes and benchmarks to judge if trading fits your strategy.
Watchlist Management: A Step-by-Step Guide for Traders
Master watchlist management with actionable steps to create, score, and prioritize your stock list. Learn thesis alignment and alerts setup for better
Florida Unemployment Amount: What You Will Actually Receive
Learn how the Florida unemployment amount is calculated, the $275 weekly cap, duration rules, and how partial earnings change your payment in 2026.
7 / 100 founding seats claimed - $100/yr locked, then $190/yr
Monsa is a portfolio-analysis tool, not a broker or investment adviser. It never recommends what to buy or sell - it checks what you hold against rules you wrote. Nothing here is investment advice.