// blog
How to Analyze Stocks with a Strategy-First Framework
Title: How to Analyze Stocks with a Strategy-First Framework
The popular guidance on how to analyze stocks usually ends too early. It teaches investors to inspect a P/E ratio, read a management narrative, compare a few peers, and form a view. That process can produce an attractive research note, but it doesn't answer the question that matters after a position enters a portfolio: does the holding still fit the rules that justified it?
A stock thesis can drift while the ticker remains familiar. Earnings estimates change, debt increases, competitive conditions weaken, or the original valuation assumption expands to accommodate disappointing facts. A repeatable process therefore needs two layers: deterministic analysis of financial and market data, plus a written strategy that can be checked repeatedly. The objective isn't to predict perfectly. It's to make thesis changes visible before they become emotional decisions.
Table of Contents
- Why Most Stock Analysis Breaks Down After You Buy
- Three forms of thesis drift
- Build the record before calculating ratios
- The Four Dimensions That Drive Any Sound Valuation Work
- Turning Prices Into Returns and Stress Testing the Numbers You Use
- Encoding Your Findings Into a Repeatable Strategy Template
- Four common template shapes
- Where Qualitative Judgment Has to Fill the Gaps Numbers Leave
- Scoring the Portfolio Against Your Rules Every Single Night
- Why the matrix matters
- Review Cadence, Position Limits, and the Test That Tells You to Sell
- The kill-test
Why Most Stock Analysis Breaks Down After You Buy
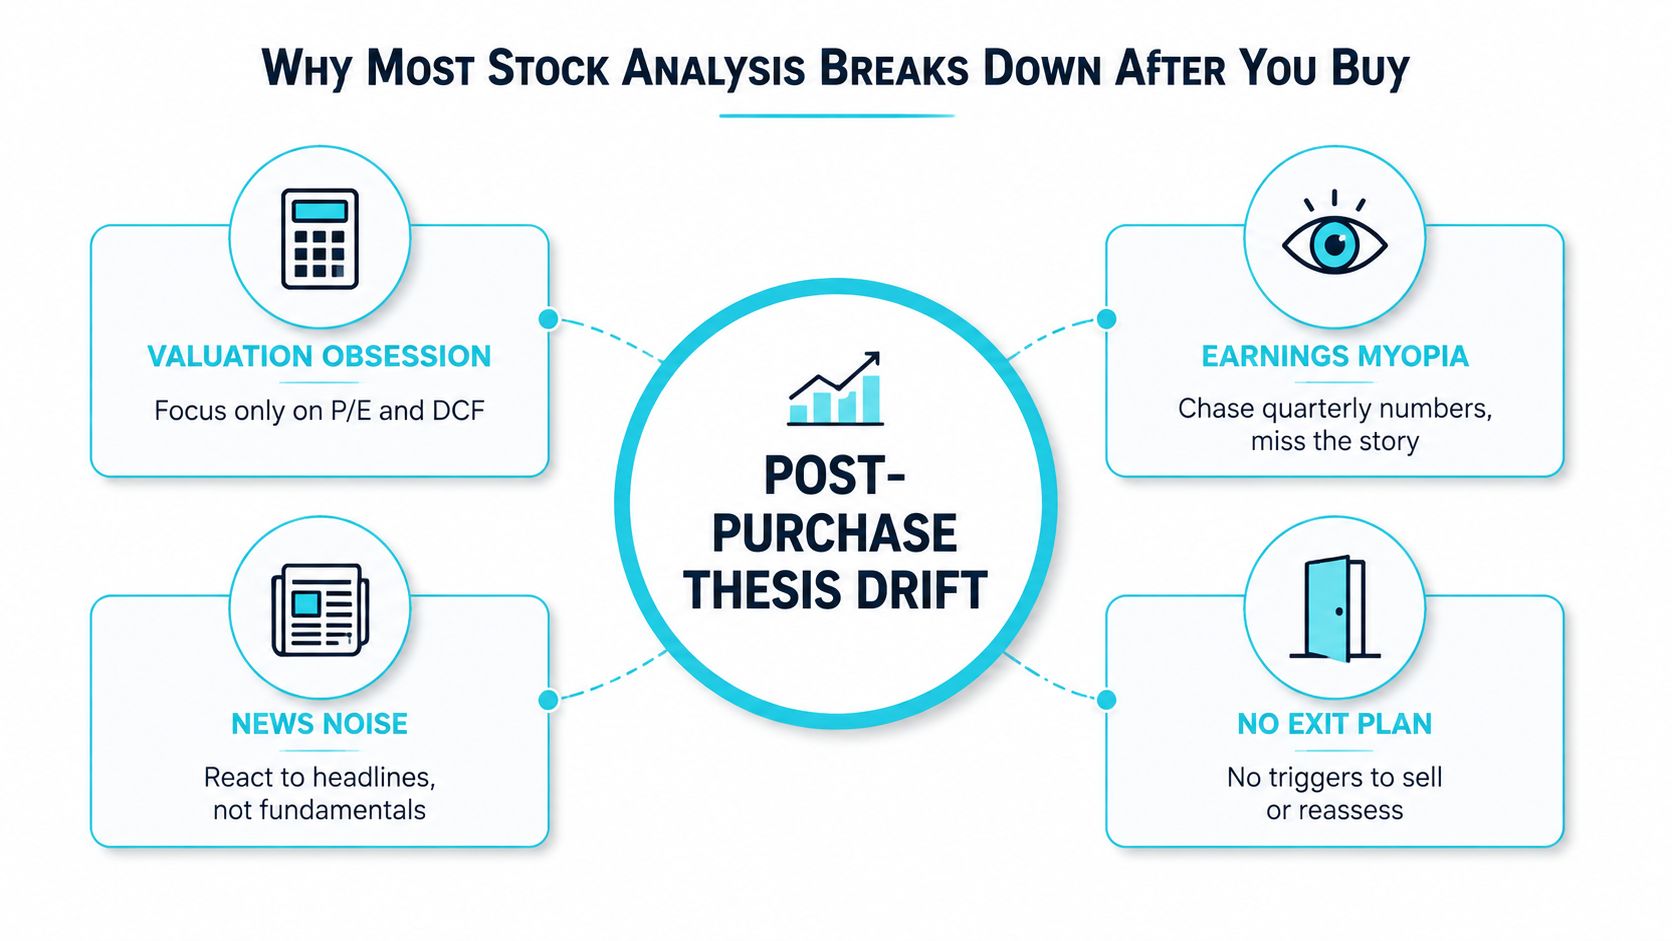
The most common failure isn't necessarily a weak initial screen. It's post-purchase thesis drift. An investor begins with a clear reason for holding a company, then gradually changes the reason without recording the change. Six quarters later, the position is defended with a narrative that may have little connection to the original valuation, growth, or risk assumptions.
Most published guides stop at the screen. They explain P/E, price-to-book, debt-to-equity, and perhaps a discounted cash flow model, but they rarely create a written test for whether the thesis remains intact. That omission matters because a valuation conclusion is only as reliable as its inputs and its time horizon. Analyst forecasts can be systematically wrong for the current and following quarter, and research summarized by the Federal Reserve describes how macroeconomic data and foreign-exchange movements can help predict errors in bottom-up S&P 500 earnings forecasts. The Federal Reserve's analysis of analyst forecast errors supports a practical discipline: treat consensus estimates as assumptions to stress-test, not as settled facts.
Three forms of thesis drift
Narrative expansion happens when every weak result creates a new explanation. A margin decline becomes a temporary investment cycle. Slower revenue becomes evidence of a longer runway. Higher debt becomes an acceptable bridge. Any individual explanation may be reasonable, but the thesis has become unfalsifiable if no condition would make the holder reconsider.
Sell-side anchoring creates a different problem. The investor's own operating model may show weaker cash conversion or rising debt, yet a familiar analyst narrative remains persuasive because it supplies a coherent story. The remedy isn't to ignore external research. It's to separate the investor's written rules from commentary and record which facts would change the conclusion.
No hard exit condition leaves the position without a defined failure state. A price decline alone may not invalidate a thesis, while a covenant issue, deteriorating unit economics, or a management change might. Without a prewritten trigger, the decision gets made under pressure, precisely when judgment is least consistent.
Practical rule: If a thesis can't state what would make the holding stop fitting, it isn't a strategy yet. It's an explanation.
Build the record before calculating ratios
Historical context comes before ratio precision. The CFA Institute notes that broad market data series reach back to the 1790s, while precise individual-stock daily price data, including ex-dividend days, splits, mergers, and other corporate actions, extend back to January 1926. Monthly total stock-market returns and the risk-free rate are available from June 1926, which helps explain why serious long-run comparisons use periods that span multiple market cycles rather than a few recent months. The CFA Institute's discussion of long-run market data also highlights the importance of adjusted price histories and corporate-action treatment.
For a company-level file, assemble the longest consistent record available from annual reports, regulatory filings, earnings releases, investor presentations, and reliable financial databases. A useful working file should include:
- Income statement history: revenue, gross profit, operating income, net income, and per-share figures, with attention to discontinued operations and accounting changes.
- Balance-sheet history: cash, debt, lease liabilities, working capital, goodwill, intangible assets, and shareholder equity.
- Cash-flow history: operating cash flow, capital expenditure, acquisitions, financing flows, and the relationship between cash generation and reported earnings.
- Segment history: segment or product revenue where the company discloses it, because consolidated growth can conceal a shrinking core business.
- Share-count history: basic and diluted shares, repurchases, splits, option dilution, and other equity issuance.
Raw GAAP figures aren't automatically comparable across a long sample. Stock-based compensation and lease obligations became more consistently visible as accounting requirements developed, so an analyst should identify the relevant reporting changes and adjust the historical series where needed. The adjustment shouldn't erase the expense. It should make the economic burden comparable across periods, preventing a company from appearing to improve only because the presentation changed.
The Four Dimensions That Drive Any Sound Valuation Work
A sound valuation review needs more than a single multiple. The stock-evaluation framework from Monsa is most useful when treated as a four-part comparison of valuation, profitability, earnings quality, and growth.
The ratio toolkit has a long research history. A Columbia University paper documents the use of valuation ratios across historical equity data, while Charles Schwab identifies P/E, PEG, ROE, P/B, and debt-to-equity as core measures that combine valuation, growth, profitability, and debt. The ratio-analysis research supports triangulation rather than single-number judgment.
| Dimension | Key Ratios | Pass Threshold | Why It Matters |
|---|---|---|---|
| Valuation | P/E, PEG, EV/EBITDA, free-cash-flow yield | Compare with sector peers and the company's own history. Investigate when free-cash-flow-to-net-income remains below 0.7 for multiple years. AlgovestIQ | Separates an appealing narrative from a price that already assumes it |
| Profitability | Gross margin, operating margin, ROE, ROIC | Require a stable or improving margin profile and ROIC that clears the chosen cost-of-capital hurdle | Tests whether growth creates economic value |
| Earnings quality | Cash conversion, accruals, stock-based compensation, net debt to EBITDA | Treat net debt to EBITDA below 3x as manageable for most businesses, and investigate flexibility when it rises above 4x. AlgovestIQ | Checks whether reported earnings translate into cash and financial capacity |
| Growth | Revenue trajectory, reinvestment, organic growth, dilution | Define growth by source, and reject a pass when expansion depends mainly on acquisitions, buybacks, or share issuance | Distinguishes durable operating progress from financial engineering |
These thresholds are starting rules, not universal laws. Sector structure, accounting conventions, and capital intensity change the interpretation. The important design choice is to write the threshold before reviewing the next result, so the standard doesn't move with the story.
Turning Prices Into Returns and Stress Testing the Numbers You Use
A raw closing price is a level, not a risk description. Convert adjusted prices into daily, weekly, and monthly returns, then examine their distribution before drawing conclusions from averages. A practical statistical workflow includes return conversion, distribution checks for skew and fat tails, variance or standard deviation, correlation, and regression against a market index, interest rates, or relevant fundamentals, as outlined in this statistical stock-analysis methodology.
The sequence matters. Return distributions often violate normality assumptions, so a single volatility estimate can understate tail risk. Compare each ticker's return behavior with its benchmark, then record whether correlation or market sensitivity has changed enough to affect the original portfolio role.
| Metric | Calculation | Tolerance Band | Action If Breached |
|---|---|---|---|
| Return series | Adjusted-price change across daily, weekly, and monthly intervals | Use consistent intervals and corporate-action adjustments | Rebuild the series before interpreting any ratio |
| Dispersion | Variance and standard deviation of returns | Compare across the selected historical windows | Reassess the risk assumption in the written strategy |
| Dependence | Correlation and regression against the benchmark or risk factors | Flag material changes from the entry profile | Review concentration and portfolio interaction |
| Tail behavior | Distribution inspection for skew and fat tails | Don't rely on normality without testing it | Stress-test the thesis under adverse paths |
The output is a risk envelope, not a forecast. It belongs beside valuation and fundamental rules because a holding can remain attractively valued while no longer fitting the portfolio's tolerated risk.
Encoding Your Findings Into a Repeatable Strategy Template
A strategy template converts research into something a portfolio can test. Each clause needs three components: a threshold, a weight, and a hard constraint. “Quality” is too vague for repeatable oversight. “ROIC must remain above the selected hurdle, debt must stay below the borrowing ceiling, and cash conversion must not deteriorate across the review window” can be checked.
The strategy-writing template from Monsa reflects the central idea: write rules in plain language first, then make them structured enough for consistent scoring. A useful template records the mandate, eligible companies, required metrics, tolerance bands, exclusions, and invalidation events.
Four common template shapes
A GARP template can emphasize growth relative to valuation, with PEG as one input and debt discipline as a constraint. A Deep Value template can focus on asset value, cash generation, and a margin of safety, while explicitly handling situations where reported book value contains large intangible balances.
A Quality Compounder template should place greater weight on profitability, reinvestment, balance-sheet resilience, and earnings quality. A Special Situation template needs event-specific milestones, financing conditions, and a defined time limit for the thesis, because a generic long-term growth rule may not fit an event-driven holding.
Don't force every mandate into the same thresholds. A strategy has to state what would invalidate it, such as a guidance reduction, a finance-leadership departure, a failed product milestone, or a structural change in customer economics. The exact event should come from the thesis, not from a generic checklist.
A strategy that can't be encoded can't be audited. An unaudited strategy is only a story with formatting.
Keep the template machine-readable. Each rule should have a field name, data source, calculation, threshold, tolerance, weight, and breach consequence. That structure allows a nightly process to distinguish a small drift from a hard violation without pretending that every judgment can be reduced to one number.
Where Qualitative Judgment Has to Fill the Gaps Numbers Leave
Financial statements describe what happened. They don't fully determine whether the same economics will persist. Qualitative judgment should therefore sit beside deterministic metrics, not replace them.
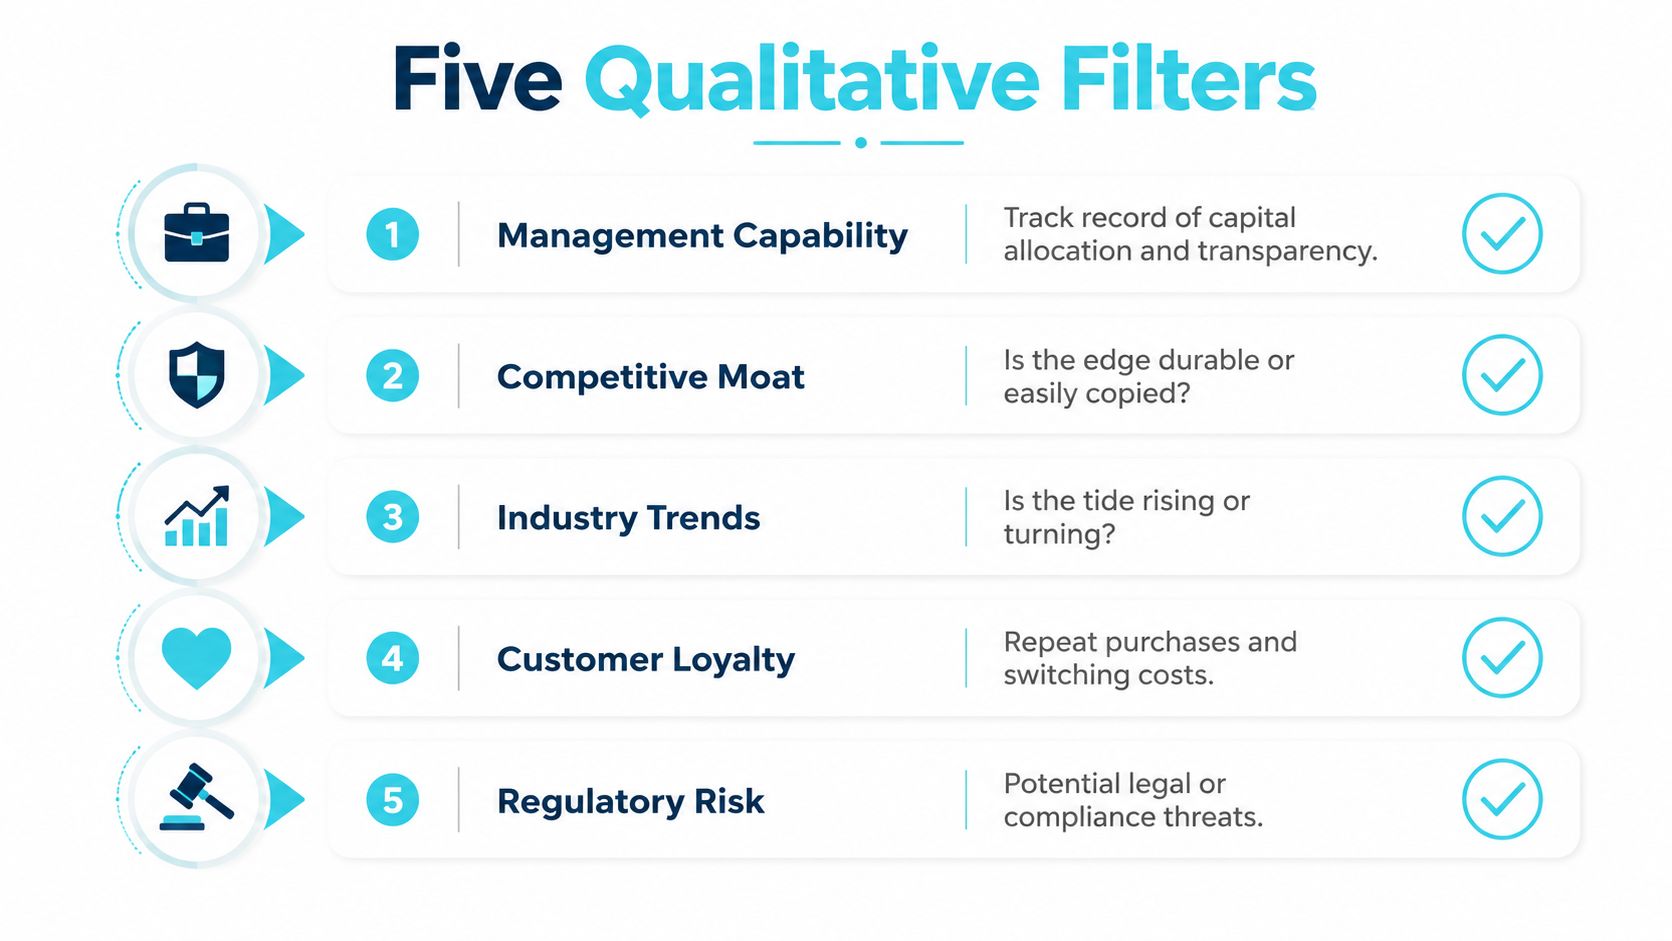
Use a 1 to 5 rating for each qualitative dimension, and require a one-line rationale tied to evidence:
- Management capability: Does the team allocate capital coherently and explain setbacks transparently?
- Competitive moat: Is the advantage durable, or can a competitor reproduce it?
- Industry direction: Is the operating environment improving, stable, or turning against the company?
- Customer loyalty: Do repeat purchases and switching costs support the revenue base?
- Regulatory risk: Could legal or compliance developments change the economics?
The rating isn't a substitute for a model. It records the judgment that the model cannot settle and makes that judgment reviewable. A company can pass a ratio screen while carrying a structural weakness, such as excessive dependence on one customer or an acquisition history that has expanded goodwill faster than tangible economic value.
The distinction between arithmetic and judgment should remain visible. Deterministic rules do the calculations. AI should handle only the questions that require interpretation, and it should show the reasoning. A qualitative verdict should identify the evidence, explain uncertainty, and state what new information would change the rating.
<iframe width="100%" style="aspect-ratio: 16 / 9;" src="https://www.youtube.com/embed/SljglCICxJs" frameborder="0" allow="autoplay; encrypted-media" allowfullscreen></iframe>
A final assessment can require both layers to clear a minimum bar. That prevents a mechanically attractive valuation from passing when management quality, competitive durability, customer dependence, or regulatory exposure undermines the original thesis.
Scoring the Portfolio Against Your Rules Every Single Night
A written strategy becomes useful when every rule produces a repeatable status. The nightly process can read the latest closing price, filing data, fundamentals, and foreign-exchange inputs, then classify each holding as fit, watch, or breach.
Fit means the holding remains inside its tolerance bands. Watch means one important condition has drifted and deserves review. Breach means a hard constraint has failed or multiple conditions have moved outside their permitted range. This is more informative than a single composite number because a holding can fit valuation rules while failing quality or risk rules.
A matrix should show the dimensions separately:
| Holding | Valuation Fit, P/E Band | Quality Fit, ROIC Above 12% | Growth Fit, Revenue CAGR | Risk Fit, 60-Day Beta Band | Verdict |
|---|---|---|---|---|---|
| Holding A | Inside ceiling tolerance | Above threshold | Meets stated rule | Inside entry band | Fits |
| Holding B | Outside valuation band | Above threshold | Meets stated rule | Inside entry band | Watch |
| Holding C | Inside valuation band | Below threshold | Below stated rule | Outside entry band | Violates |
The example rules are explicit: P/E can remain within 20% of the strategy ceiling, ROIC must remain above 12%, and 60-day beta must stay within plus or minus 0.2 of the entry reading. These are not universal standards. They're illustrations of the precision needed for a scorecard that doesn't change meaning from one night to the next.
Why the matrix matters
A single score can hide the source of deterioration. A matrix shows whether the problem is price, operating quality, growth, or portfolio risk. It also creates a prioritised morning queue: review hard breaches first, then watch items, then holdings that remain inside the rules.
The portfolio-monitoring workflow from Monsa follows this strategy-versus-portfolio framing. The product stores an operator's rules, evaluates tracked stocks against those rules, and presents per-criterion reasoning rather than treating the score as a black box. The operator still decides what the rules mean and what action follows.
Review Cadence, Position Limits, and the Test That Tells You to Sell
Nightly scoring isn't a complete process without a calendar. A written investment policy statement commonly separates monitoring from formal review: one sample policy requires rebalancing when an asset class leaves its constraints or at least annually, with compliance reviewed at least quarterly and the policy itself at least annually. The HFMA investment policy example shows why cadence and tolerance bands belong in the same document.
A practical routine can be short and still structured:
- Pre-market scan: Check new filings, material news, overnight price gaps, and any hard-rule alerts.
- Weekly review: Examine every breach, update thesis notes, and identify whether a watch item reflects temporary noise or a changed business fact.
- Monthly allocation check: Compare position sizes and sector exposure with written limits.
- Quarterly deep dive: Rebuild the operating case from the latest filing, reassess assumptions, and confirm that the holding still belongs in the strategy.
Position limits turn concentration into a rule rather than a feeling. An operator might set a single-name cap at 5%, a sector cap at 25%, and a maximum of 18 positions, but the correct limits depend on the written mandate and risk tolerance. Diversification across assets, sectors, and regions, combined with a margin of safety, connects company analysis to portfolio construction rather than treating each stock as an isolated idea. This fundamentalist portfolio framework makes that connection explicit.
The kill-test
Write one sentence before the next review:
What would have to be true for this holding to stop fitting within the next 30 days?
A useful answer names an observable fact, such as a leverage breach, a failed operating milestone, a permanent margin reset, or a management event that changes execution capacity. A vague answer means the position has no operational exit condition.
Research on analyst target prices illustrates why external forecasts need humility. One study found an upward bias of 9.4%, absolute pricing errors of 24.8%, and directional accuracy of 54%. The target-price research reinforces the value of a thesis-based review rather than outsourcing the decision to a forecast.
The workflow's purpose is not to manufacture certainty. It's to preserve the link between written rules and actual holdings. Monsa stores an operator's strategy and scores the stocks they hold against it every night, with deterministic rules handling the arithmetic and judgment shown separately.
Monsa turns a written equity strategy into checkable criteria, then scores tracked holdings against those rules each night with per-criterion reasoning and fit verdicts. Visit Monsa to see how a strategy-first portfolio review can make thesis drift visible in your own book.
Monsa is a portfolio-analysis tool, not a broker or investment adviser. Nothing here is investment advice.
// related reading
What Is Portfolio Turnover and Why It Matters
What is portfolio turnover? Learn the SEC formula, worked examples, costs, taxes and benchmarks to judge if trading fits your strategy.
Watchlist Management: A Step-by-Step Guide for Traders
Master watchlist management with actionable steps to create, score, and prioritize your stock list. Learn thesis alignment and alerts setup for better
Florida Unemployment Amount: What You Will Actually Receive
Learn how the Florida unemployment amount is calculated, the $275 weekly cap, duration rules, and how partial earnings change your payment in 2026.
7 / 100 founding seats claimed - $100/yr locked, then $190/yr
Monsa is a portfolio-analysis tool, not a broker or investment adviser. It never recommends what to buy or sell - it checks what you hold against rules you wrote. Nothing here is investment advice.