// blog
What Is Portfolio Turnover and Why It Matters

Portfolio turnover is the lesser of a fund's purchases or sales divided by its monthly average portfolio value, with 100% turnover meaning roughly one full portfolio worth of securities was replaced during the year. It measures how much of a portfolio changed hands, not whether the trading was disciplined, necessary, or successful.
You may be looking at a portfolio today and wondering why it no longer resembles the strategy you wrote when you started. A quality-focused book can accumulate more speculative holdings. A dividend strategy can retain positions that no longer meet its income rules. A momentum process can keep stale names after its signals have changed. The trades may have happened gradually, making the drift difficult to notice.
Turnover gives you a numerical view of the activity behind that change. It doesn't tell you whether every trade improved the portfolio's fit with its written rules, but it can show whether the book is mostly stable, being regularly refreshed, or changing at a pace that deserves closer examination.
Table of Contents
- Introduction to Portfolio Turnover for Disciplined Operators
- What Portfolio Turnover Really Measures
- From intuition to the formal definition
- What the percentage doesn't measure
- The Portfolio Turnover Formula Explained Step by Step
- The three inputs
- Why the lesser figure is used
- Worked Examples That Make the Math Concrete
- Example one, growth changes the denominator
- Example two, the smaller active book
- How Turnover Relates to Costs Taxes and Execution
- The cost side
- The tax side
- Benchmarks by Strategy Type and How to Judge Fit
- Match activity to design
- A practical fit test
- Keeping Turnover Aligned With Your Written Strategy
Introduction to Portfolio Turnover for Disciplined Operators
An operator might review a portfolio after a busy period and remember several purchases and sales, yet still have no clear sense of how much of the book changed. Raw trade counts don't answer that question. A handful of large transactions can alter a portfolio more than many small adjustments, and the same trading activity means something different in a large book than in a small one.
The SEC's definition solves that comparison problem by scaling trading activity against portfolio size. The standard measure uses the lesser of purchases or sales and divides it by the average value of portfolio securities over the reporting period. This creates an activity rate rather than a simple count of transactions, as described in the SEC filing framework for portfolio turnover.
Practical rule: Read turnover as a description of portfolio change first, and as a judgment about process only after comparing it with the strategy's written rules.
That distinction matters for disciplined operators. A high-turnover strategy may require frequent changes to remain aligned with its signals. A long-horizon strategy may treat frequent replacement as a sign that its holding criteria are unclear or that the operator is reacting outside the plan. Neither conclusion comes from turnover alone.
This guide translates the formula into plain language, walks through the arithmetic, and separates three ideas that are often blended together: how much trading occurred, what friction it created, and whether the resulting holdings still fit the strategy. It also addresses the question many explanations skip: when can turnover be appropriate rather than merely high or low?
Monsa gives operators another way to examine that final question. Monsa scores the stocks an operator holds against the strategy they wrote down, every night, so turnover can be considered alongside the book's ongoing fit with its stated rules rather than treated as an isolated activity score.
What Portfolio Turnover Really Measures
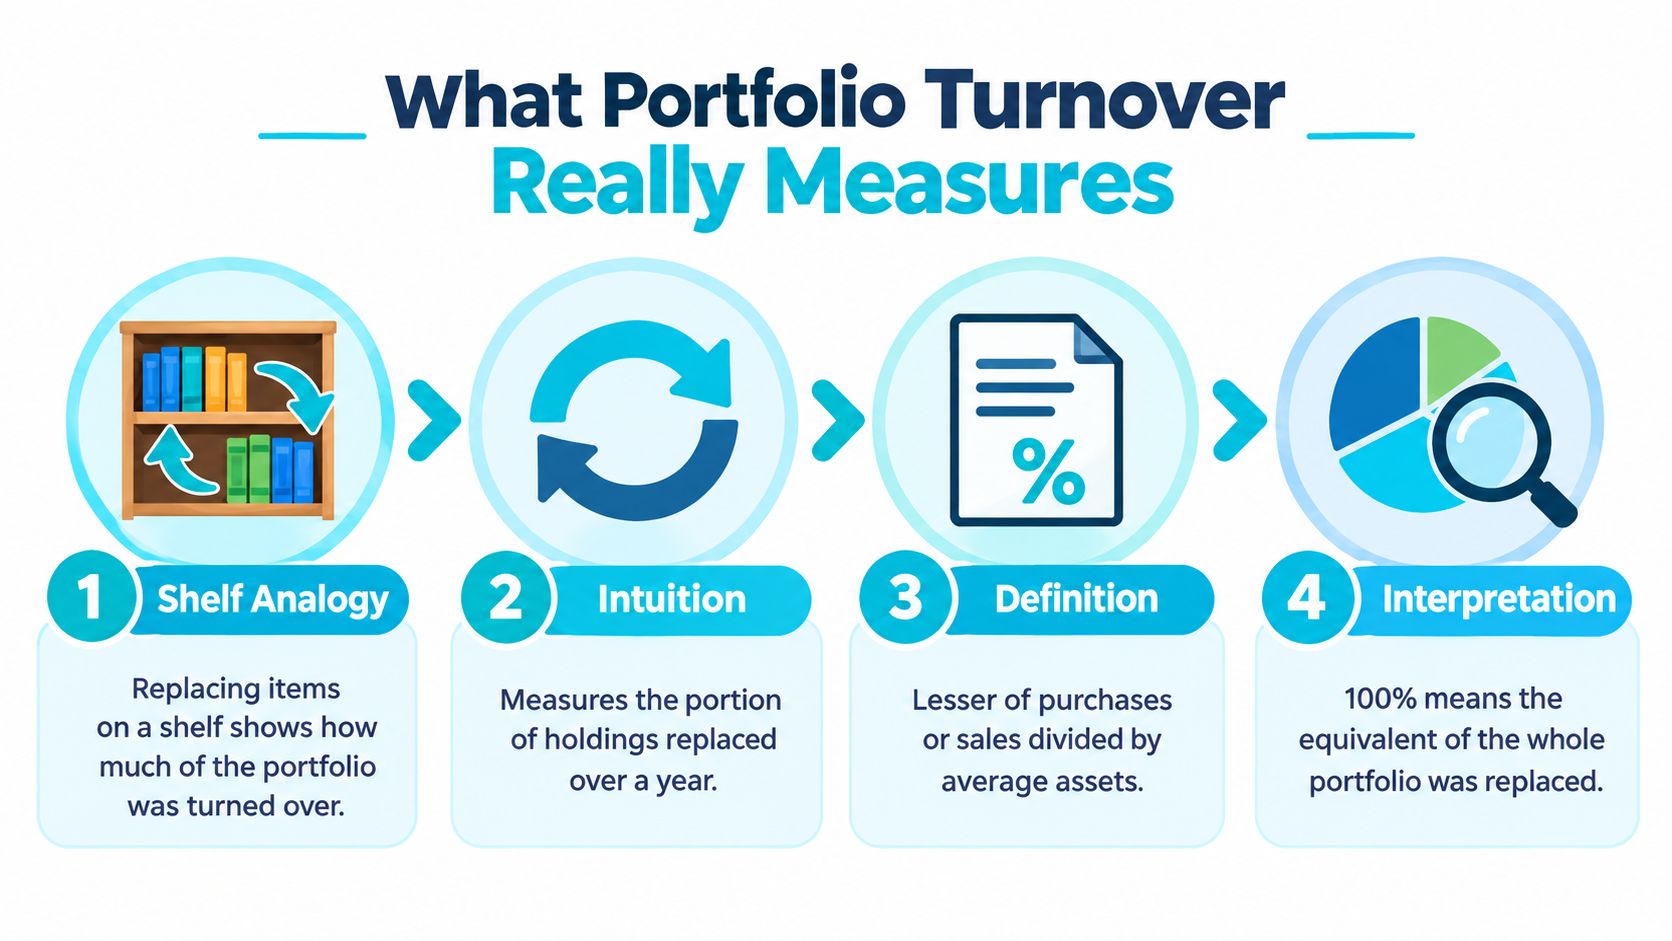
Start with a bookshelf. If you replace one book while leaving the rest in place, only a small part of the shelf has changed. If you remove nearly every book and replace the collection, the shelf has experienced substantial turnover. The analogy works because portfolio turnover focuses on replacement of holdings, not on the number of times you touched the shelf.
From intuition to the formal definition
The SEC measure has three important parts:
1. Purchases and sales: The calculation considers the dollar value of portfolio securities bought and sold during the fiscal year. 2. The lesser amount: It uses whichever is lower, total purchases or total sales, which avoids counting both sides of the same replacement activity. 3. Average portfolio value: It divides that amount by the monthly average value of portfolio securities owned during the year.
The resulting percentage estimates the portion of the portfolio that changed hands during the reporting period. The SEC definition also excludes securities maturing in one year or less from both the numerator and denominator, so short-duration instruments don't distort the standard measure. The historical formula and its regulatory context are discussed in this analysis of the SEC turnover disclosure rule.
A 100% turnover rate doesn't mean the fund made one hundred separate trades or that every holding changed exactly once. It means the value of securities traded, using the formula's lesser-of-purchases-or-sales convention, was about equal to the portfolio's average value over the year. In ordinary language, the fund traded the equivalent of roughly one portfolio's worth of securities.
What the percentage doesn't measure
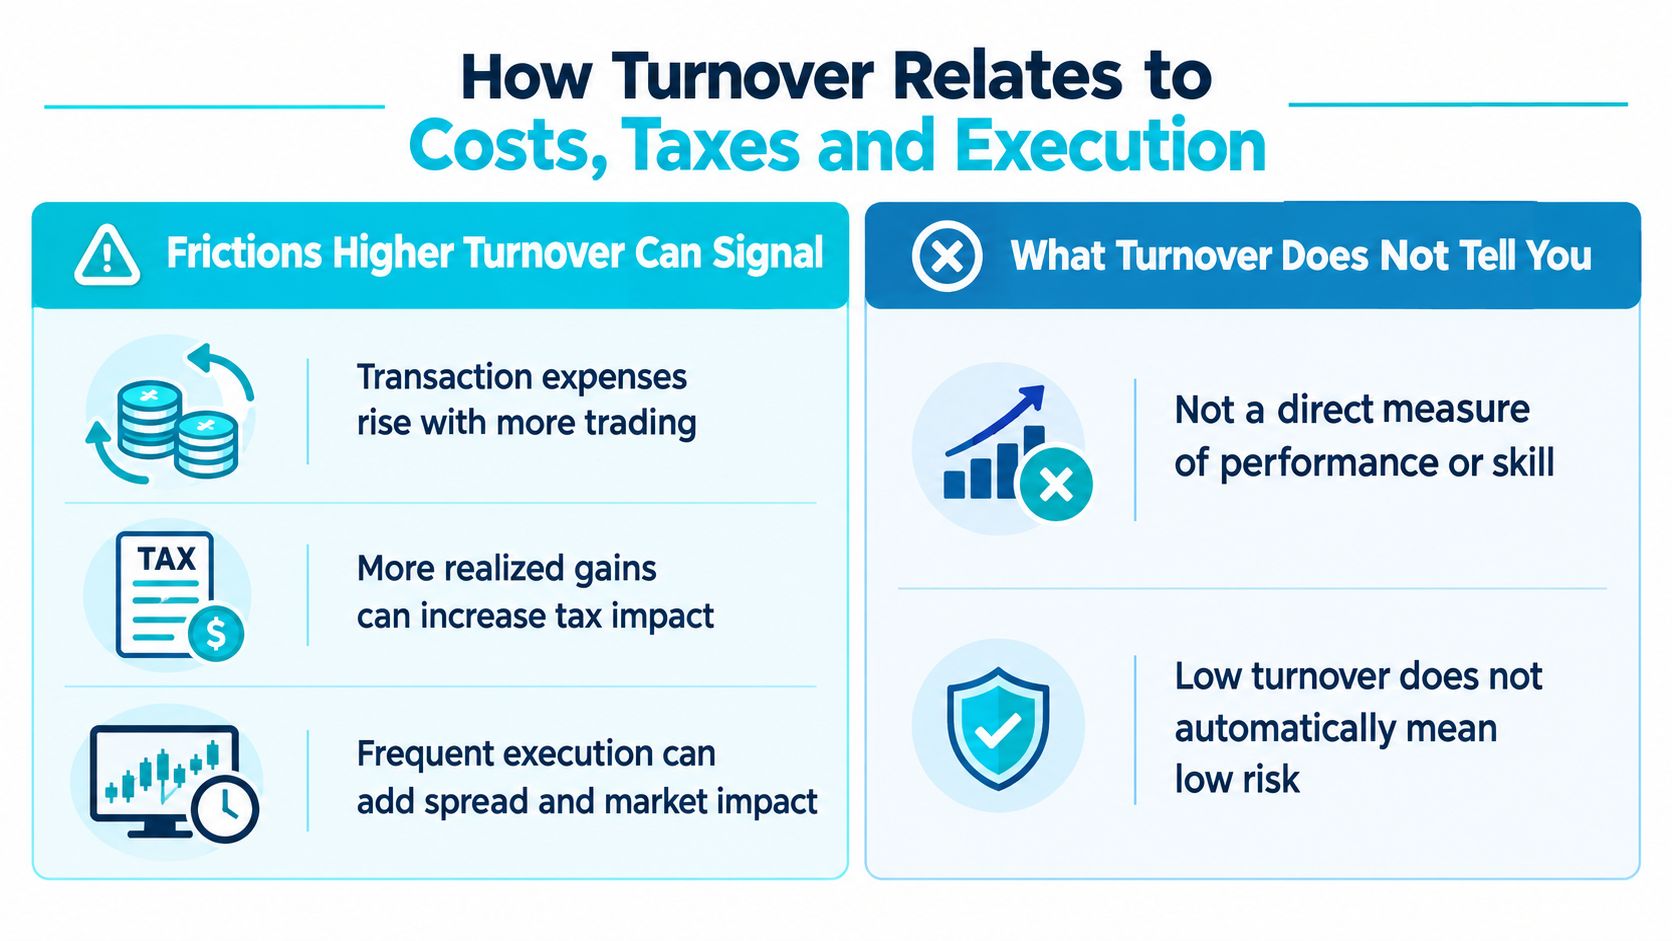
Turnover isn't a direct measure of portfolio quality, manager skill, risk, or performance. It also isn't the same as transaction costs. Instead, it provides a standardized view of trading intensity that can help you ask better follow-up questions.
Two portfolios can have the same number of trades but different turnover because their trade sizes or average assets differ. A portfolio can also have low turnover while holding a position that no longer fits its written thesis. That is why turnover works best as a process lens, paired with explicit strategy constraints and holding-level review.
The Portfolio Turnover Formula Explained Step by Step
A portfolio can trade frequently for two different reasons. Each trade may keep holdings aligned with written rules, or it may add costs without improving the fit. The formula helps separate activity from the question that matters: whether the trading supports the strategy.
The formula is:
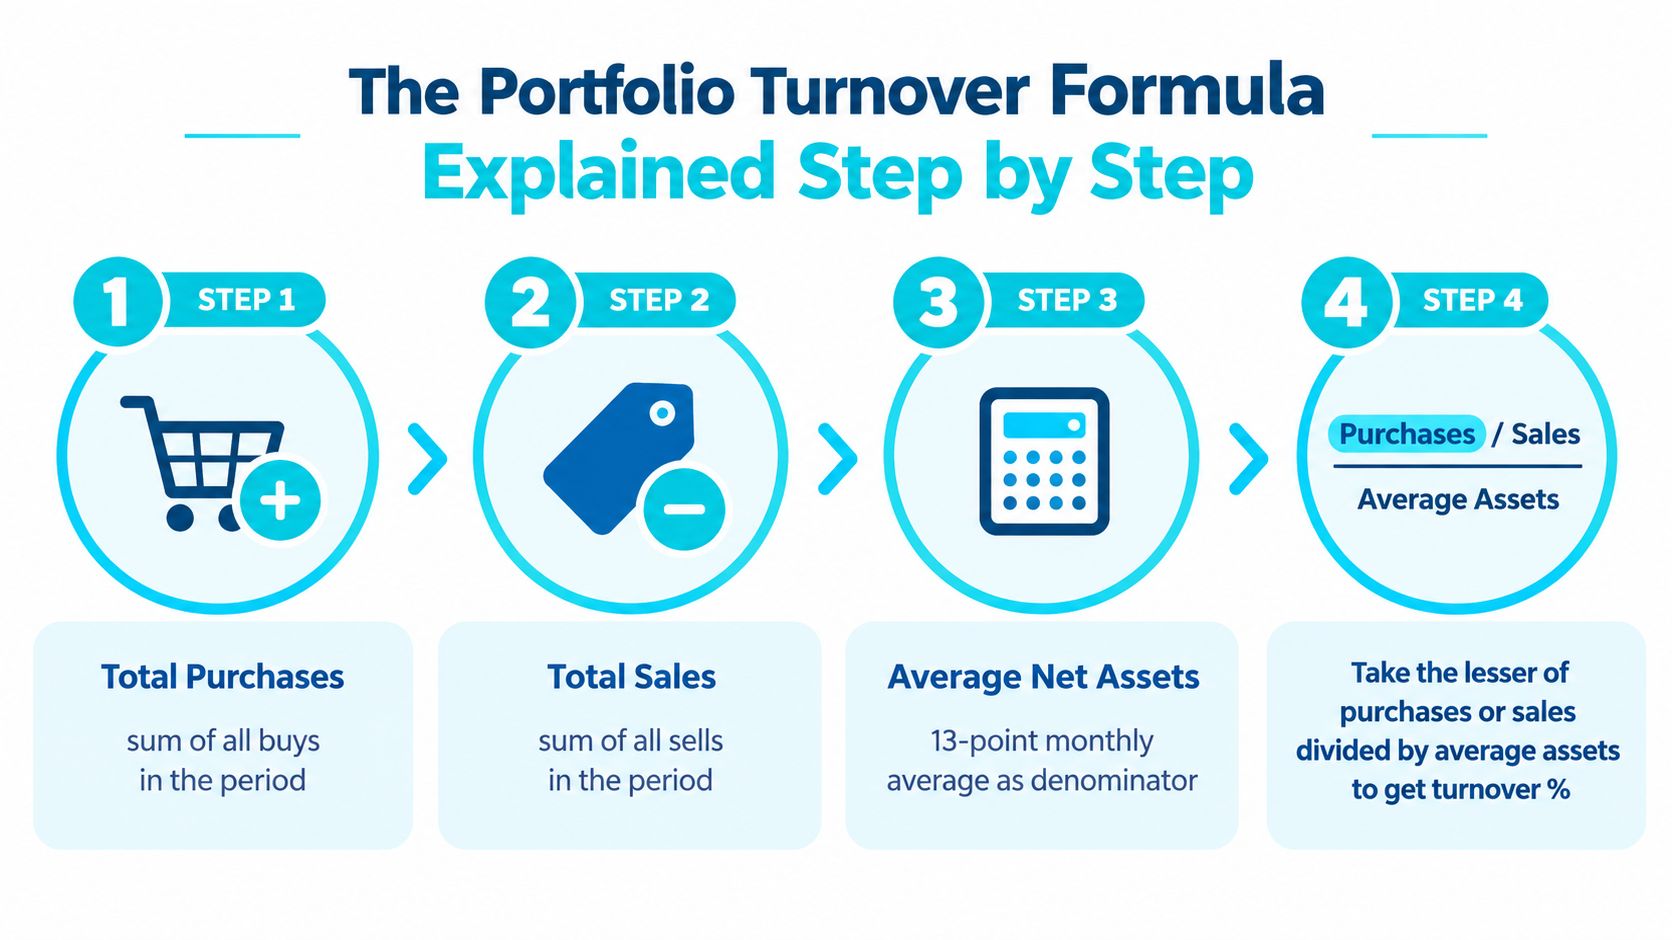
Portfolio turnover = lesser of total purchases or total sales ÷ average portfolio value
The SEC's Form N-1A instructions define the denominator using a 13-point monthly average across the fiscal year. These points include the portfolio's value at the start of the period and at the end of each month. Averaging them reduces the influence of one unusually high or low snapshot. The SEC Form N-1A instructions describe this reporting convention.
The three inputs
Total purchases is the dollar value of portfolio securities acquired during the fiscal year. Total sales is the dollar value of securities disposed of during that period. The calculation therefore measures trading value, not the number of order tickets or individual transactions.
Average portfolio value is the denominator. Add the portfolio values recorded at the 13 required monthly points, then divide the result by 13. It works like averaging several photographs of the book instead of judging its size from one frame.
Why the lesser figure is used
The formula takes the lower of purchases and sales because a replacement involves two sides. Selling one holding and buying another does not represent two complete portfolio changes. Counting both sides would make one transition look like twice the activity. The lesser figure gives a normalized estimate of the portfolio value replaced.
This convention also makes turnover more useful than a raw trade total. The same dollar amount of trading represents a larger share of a small book than of a large one. A manager can then ask whether the resulting activity reflects a required rebalance, a changed thesis, or avoidable friction.
The fiscal-year window shapes the interpretation. A concentrated burst of trading may be softened by quieter months, so the disclosed figure is a period-level summary rather than a live reading of recent changes. Use it alongside holding reviews and the strategy's written rules.
<iframe width="100%" style="aspect-ratio: 16 / 9;" src="https://www.youtube.com/embed/BIsROkyn3oc" frameborder="0" allow="autoplay; encrypted-media" allowfullscreen></iframe>
Worked Examples That Make the Math Concrete
Turnover can change when the portfolio's size changes during the reporting period. A year-end value alone may give the wrong impression, because the formula uses the average portfolio value across the period.
Example one, growth changes the denominator
A portfolio begins the period at $200,000, receives a large contribution, and finishes at $400,000. Its recorded monthly values produce an average portfolio value of $300,000. During the same period, it has $120,000 in purchases and $60,000 in sales.
The formula uses the lesser amount, $60,000:
$60,000 ÷ $300,000 = 20%
Using the $400,000 year-end value instead would produce a smaller percentage, even though that value did not represent the portfolio for the whole period. The average denominator keeps the calculation tied to the book's size across the reporting window.
Example two, the smaller active book
A second portfolio has $180,000 in purchases and $150,000 in sales against a $150,000 average portfolio value. The lower trading figure equals the denominator.
$150,000 ÷ $150,000 = 100%
That result does not mean every position was replaced once in a tidy sequence. It means the portfolio traded securities worth approximately one average portfolio's value under the standard calculation.
A large cash flow can also affect interpretation. Suppose an investor adds money near the end of the period. The portfolio may finish much larger, while earlier monthly values keep the average denominator lower. The resulting turnover percentage can therefore look high even when the operator traded mainly to put new cash to work. An outflow can create the opposite effect if sales reduce the book's size after much of the period has passed.
The practical question is whether the activity fits the written strategy. A rebalance that restores target weights may show turnover serving a clear rule. Trading that lacks a portfolio-level reason may add activity without improving alignment.
The contrast remains useful: turnover reflects trade size relative to portfolio size, not order count alone. Two operators can place similar numbers of orders yet report different percentages when their average portfolios differ.
How Turnover Relates to Costs Taxes and Execution
Trading changes more than the list of holdings. It can also create frictions that aren't visible in the portfolio's stated operating-expense figure. The SEC warns that higher turnover can increase transaction expenses and may generate taxable capital gains distributions for shareholders, as described in its investor disclosure language on turnover, costs, and taxes.
The cost side
Each transaction can involve commissions, bid-ask spreads, market impact, and other execution frictions. These costs can accumulate even when a fund's operating-expense ratio appears unchanged. The SEC fund disclosure example on turnover-related expenses and tax effects makes the distinction clear: trading costs sit outside the stated operating expenses.
Execution quality becomes more important as the portfolio changes more frequently. An operator following a written rebalance rule may accept that friction because the trade is required to restore the intended portfolio structure. An operator trading without a defined trigger may create costs without a clear process reason.
The tax side
In a taxable account, selling securities can realize gains. A fund with higher turnover may distribute more taxable capital gains, and the shareholder can face tax consequences even when they didn't personally place the underlying trades. The effect depends on the fund's realized gains, distributions, holding period, and account context, so turnover is an alert to investigate rather than a tax calculation by itself.
Turnover also can't tell you whether trading improved strategy fit. A low-turnover portfolio may preserve a holding that violates a hard constraint, while a high-turnover portfolio may be following a legitimate rules-based process. Operators can use a portfolio rebalancing tool to think about turnover limits as part of a broader set of implementation rules.
Execution question: What written rule required this trade, and what evidence shows that the replacement still fits the strategy?
Benchmarks by Strategy Type and How to Judge Fit
There is no universal turnover level that suits every strategy. Holding period, rebalance frequency, position limits, tax design, and the speed of the underlying signals all shape the appropriate activity range.
The comparison below uses the strategy ranges specified for this guide. These ranges are orientation points, not prescriptions, and they shouldn't replace the thresholds written into an operator's own process.
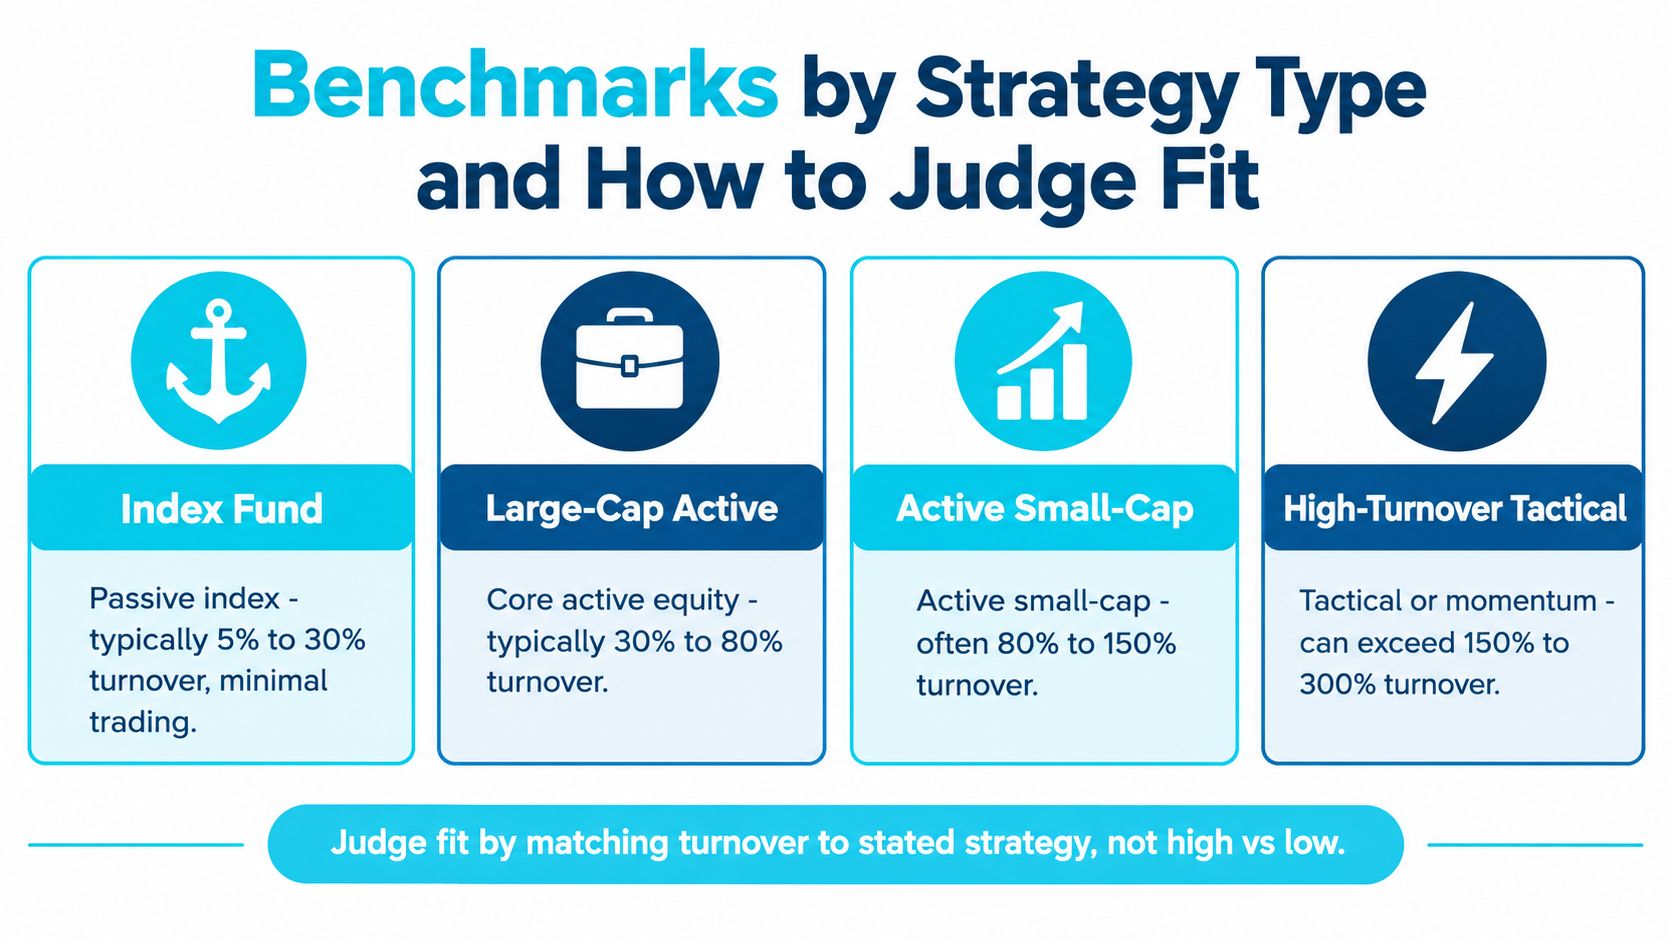
| Strategy type | Typical turnover range | What usually drives the activity |
|---|---|---|
| Index fund | 5% to 30% | Limited changes, often linked to index maintenance |
| Core active equity | 30% to 80% | Selective replacement and periodic thesis review |
| Active small-cap | 80% to 150% | More frequent research updates and position changes |
| Tactical or momentum | 150% to 300% | Rapid response to changing signals and exposure rules |
Match activity to design
An index-oriented process with high turnover deserves investigation because it may not resemble the intended implementation. A tactical process with low turnover also deserves investigation if its written rules require prompt responses to changing signals. The question isn't whether one figure is morally better. The question is whether observed activity matches the process the operator intended to run.
For a quality compounder, a long holding period may make lower turnover coherent. Dividend growth may also favor stability, while classic value can require more replacement when valuation or thesis conditions change. GARP and momentum approaches can produce more activity when their rules respond to changing growth, valuation, or price conditions.
Use active versus passive portfolio management as a conceptual comparison, then inspect the actual rules behind the label. Two portfolios can use the same strategy name while applying different thresholds and rebalance triggers.
A practical fit test
Ask four questions:
- What is the intended holding period? Does the measured activity make sense beside the time horizon in the written strategy?
- What triggers replacement? Are trades tied to valuation, fundamentals, risk limits, signals, or informal reactions?
- What tolerance band applies? Does the strategy permit temporary drift before requiring action?
- What does the book now contain? Does each holding still satisfy the stated criteria, regardless of the turnover headline?
High turnover isn't automatically wasteful, and low turnover isn't automatically disciplined. Fit comes from the relationship between activity and rules.
Keeping Turnover Aligned With Your Written Strategy
Turnover becomes useful when it supports a repeatable review rather than acting as a score to maximize or minimize. Start with the measured figure, then compare it with the strategy's intended holding period, replacement triggers, and tolerance for drift.
A concise operator checklist can keep that review concrete:
- Confirm the measurement window: Identify the fiscal year and the portfolio value used in the average.
- Verify the inputs: Check purchases, sales, exclusions, and the lesser-of-purchases-or-sales convention.
- Review the triggers: Connect each material replacement to a written rule or documented exception.
- Inspect current fit: Test every holding against the strategy's criteria, including hard constraints and position limits.
- Separate friction from alignment: Record whether activity restored the intended structure or merely added implementation cost.
- Track the pattern: Compare the current figure with prior reporting periods and the strategy's own tolerance band.
The most important question is not “Is turnover high?” It is “Does the portfolio's rate of change match the process its operator chose?” A book can drift while turnover remains low, especially when an operator avoids necessary decisions. A book can also remain faithful to its rules while turnover is high because the strategy deliberately responds to changing evidence.
Monsa's approach fits this discipline check by scoring the stocks an operator holds against the strategy they wrote down every night. Its deterministic rules handle the arithmetic, while AI judges only the parts that require judgment and shows the reasoning, so operators can inspect fit without treating the score as a black box. That nightly view can help surface portfolio drift between periodic turnover reviews.
Process reminder: Use turnover to start a conversation with your rules, not to replace them.
Measure the activity, trace the reasons, inspect the current holdings, and document exceptions. That sequence keeps turnover in its proper role, a way to understand portfolio change and its potential friction while preserving attention on strategy fit.
Visit Monsa to score the stocks you hold against the strategy you wrote down, with transparent rule-based calculations and reasoning for the judgments that require context. Use the nightly fit view to connect turnover review with ongoing checks for thesis drift and portfolio discipline.
Monsa is a portfolio-analysis tool, not a broker or investment adviser. Nothing here is investment advice.
// related reading
Watchlist Management: A Step-by-Step Guide for Traders
Master watchlist management with actionable steps to create, score, and prioritize your stock list. Learn thesis alignment and alerts setup for better
Florida Unemployment Amount: What You Will Actually Receive
Learn how the Florida unemployment amount is calculated, the $275 weekly cap, duration rules, and how partial earnings change your payment in 2026.
XLU Ex Dividend Date 2026 and How to Read It
Find the latest XLU ex dividend date for 2026, learn how quarterly payouts work, and see how T+1 settlement changes who actually receives the distribution.
7 / 100 founding seats claimed - $100/yr locked, then $190/yr
Monsa is a portfolio-analysis tool, not a broker or investment adviser. It never recommends what to buy or sell - it checks what you hold against rules you wrote. Nothing here is investment advice.