// blog
Active vs Passive Portfolio Management: A Practical Guide
In 2025, 79% of active U.S. large-cap equity funds underperformed the S&P 500, which S&P Global described as the fourth-worst year for active large-cap managers in the 25-year history of its scorecards. (SPIVA U.S. Persistence Scorecard) That figure sharpens the central question. Active vs passive portfolio management isn't mainly a contest over which label sounds more impressive. It's a question of whether a portfolio follows a written process, how much deviation that process permits, and who checks whether the holdings still fit.
Passive exposure uses rules to replicate an index, while active management uses judgment to select securities, adjust weights, or alter exposure. Both approaches can sit inside a serious portfolio. The difference is whether oversight focuses on index adherence or thesis adherence.
Table of Contents
- The Active vs Passive Balance in 2026
- Two different operating systems
- Defining Each Approach and How Tracking Error Works
- A worked example
- Side by Side on Cost, Risk and Decision Style
- Active vs Passive at a Glance
- Oversight is the hidden criterion
- Where Active Has Historically Lagged and Where It Has Held
- Read categories separately
- Costs, Fees and the Compounding Gap
- Why the gap changes the job
- Which Investor Profile Fits Which Approach
- Match the wrapper to the work
- A Hybrid Rule-Based Workflow That Combines Both
- Build the workflow in four stages
- Use alerts as review triggers
- Frequently Asked Questions About Active and Passive Investing
- Can passive lose to itself?
- How does rebalancing frequency affect tracking error?
- Why do index inclusion rules matter?
- When do active funds shut down?
- Should the split change as portfolio size grows?
The Active vs Passive Balance in 2026
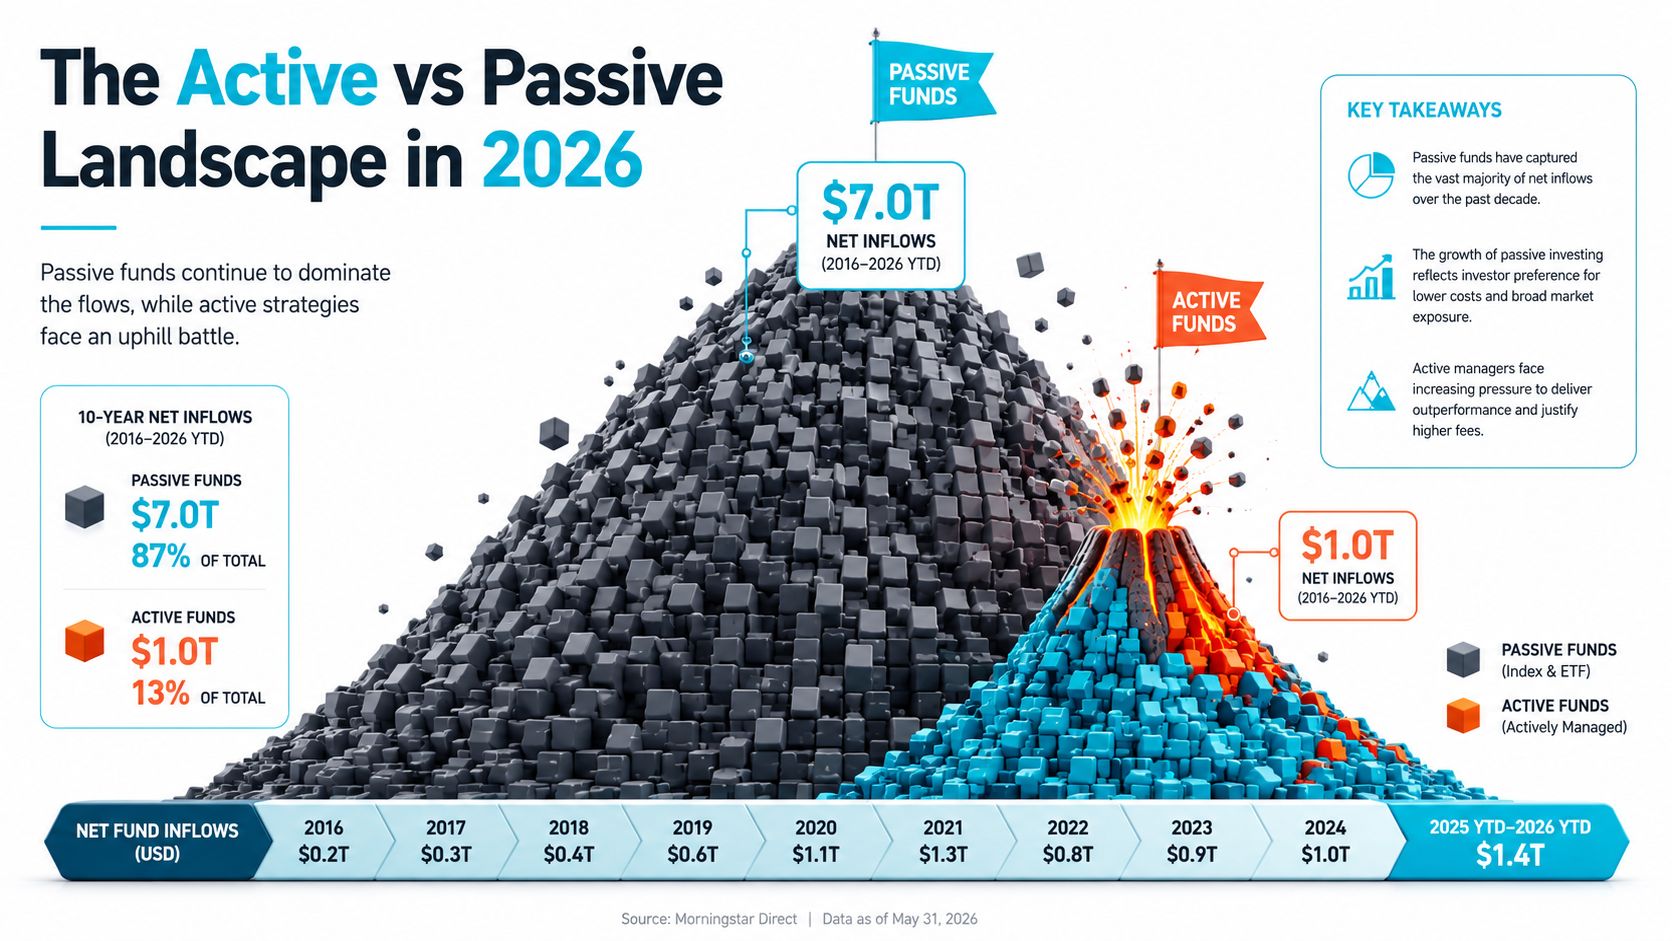
Europe and the United States show different patterns. In Europe, active mutual funds and ETFs still held about EUR 9.3 trillion by the end of September 2025, compared with EUR 4.1 trillion for passive products. In the United States and globally, passive management has become a central portfolio building block. Morningstar reported that passively managed assets exceeded USD 19.1 trillion by October 2025, compared with USD 16.2 trillion in actively managed assets. (Morningstar active versus passive research)
The contrast matters because no single label settles the portfolio decision. Passive exposure is widely used where consistent benchmark exposure is the assignment. Active management remains relevant where an operator has a defined reason to depart from that benchmark. The allocation should be judged by whether its process can be written, monitored, and reviewed.
Two different operating systems
Active management gives a manager or operator discretion over security selection, sector exposure, position sizing, and timing. Departing from the benchmark requires more than a view on securities. Each deviation needs a stated reason, a time horizon, and a condition that would invalidate the thesis. Oversight should test those conditions rather than reward activity for its own sake.
Passive management follows an index methodology and seeks close benchmark replication. Its implementation rules aim to keep divergence small, but they do not remove oversight. Index reconstitutions can create turnover, index weights can produce concentration, and the resulting exposure may no longer fit an operator's broader allocation plan.
The useful distinction is where the rules live. A passive fund inherits much of its process from the index methodology. An active portfolio depends on rules written and enforced by the manager or operator. Monsa's portfolio monitoring workflow helps check whether holdings still align with the documented strategy.
Practical rule: Treat every active position as a testable claim. Treat every passive allocation as a rules engine whose methodology still requires review.
Defining Each Approach and How Tracking Error Works
The cleanest technical dividing line is tracking error. In portfolio management, tracking error is the standard deviation of the difference between a fund's returns and its benchmark returns. Lower tracking error indicates tighter benchmark adherence, while higher tracking error indicates greater active risk. (Evaluation methods for portfolio management)
A passive portfolio is optimized to minimize tracking error under practical implementation constraints. It may not replicate every index constituent perfectly because of fees, cash balances, sampling, corporate actions, or trading conditions, but its operating objective remains close benchmark behavior.
An active portfolio accepts benchmark deviation. The manager may hold fewer securities, assign different weights, avoid an industry, or maintain cash. Those choices create active risk, and the risk is not automatically a flaw. It is the measurable consequence of having a thesis that differs from the index.
A worked example
Consider an index portfolio holding 500 stocks. If it records a hypothetical 10% result with 0.5% tracking error, the portfolio is behaving close to its benchmark. Now consider a concentrated active fund holding 80 stocks with a hypothetical 11.2% result and 4.8% tracking error.
The difference between the portfolio result and the benchmark result is the active return. The information ratio divides that active return by tracking error, so the example produces an information ratio above 0.2 if the benchmark result is 10%. These figures are illustrative mechanics, not evidence that either portfolio is preferable.
For an operator writing rules, the lesson is straightforward:
- Benchmark definition: Specify the reference index before evaluating deviation.
- Deviation tolerance: Decide how much tracking error the mandate permits.
- Reason for deviation: Record whether a difference comes from selection, sector weight, cash, or implementation.
- Review condition: Define what evidence would cause a position or sleeve to return toward benchmark weight or remain outside it.
SPIVA makes the net-of-fee hurdle explicit. Its methodology measures fund returns after fees, which means any active process must account for the cost of its deviation before its benchmark-relative result has practical meaning. (SPIVA methodology and overview)
Side by Side on Cost, Risk and Decision Style
The labels become useful when translated into operating requirements. An index portfolio delegates most security-level decisions to an index methodology. An active portfolio keeps those decisions inside the manager's process, which creates more responsibility for monitoring, documentation, and review.
Active vs Passive at a Glance
| Criterion | Active Management | Passive Management |
|---|---|---|
| Decision style | Discretionary security selection, position sizing, sector tilts, and timing | Rules-based replication of an index |
| Costs | Usually includes management research, portfolio activity, and trading friction | Typically carries lower administration and trading complexity |
| Risk behaviour | Accepts benchmark-relative active risk and larger deviations | Seeks tight benchmark adherence and limited tracking error |
| Time commitment | Requires ongoing thesis, risk, and position review | Often supports a set-and-review workflow |
| Transparency | Depends on the manager's reporting and explanation of decisions | Index methodology and composition provide a defined reference point |
The decision-style row determines how an operator should keep records. Passive exposure can be reviewed against index composition, tracking difference, and allocation targets. Active exposure needs a thesis record that explains why each holding exists and what would make that reason no longer valid.
Costs aren't limited to a fund's headline fee. Active implementation can involve research, turnover, spread costs, and the market impact of trading. Passive implementation generally reduces decision frequency, but it still has fund expenses, rebalancing activity, and the operational effects of index changes.
Risk behaviour also deserves precise language. Passive exposure isn't risk-free. It usually carries the risk of the selected benchmark, including any concentration embedded in that index. Active risk is different. It comes from the gap between the portfolio and its reference index, so an operator needs to know whether that gap is intentional.
Oversight is the hidden criterion
Transparency changes the work rather than removing it. A published index tells an operator what the passive sleeve is designed to hold, while an active manager's report may require interpretation of changing exposures and stated rationale.
A portfolio can be passive at the fund level and undisciplined at the household level if its allocation drifts without a written review rule.
That is why time commitment should be defined by the workflow, not by the product label. A passive core may need periodic allocation checks. An active sleeve needs more frequent attention to thesis fit, constraints, and changes in the underlying evidence.
Where Active Has Historically Lagged and Where It Has Held
Long-horizon evidence argues against treating active management as a single category. SPIVA scorecards show recurring difficulty for active U.S. large-cap funds relative to the S&P 500, with the gap often becoming more pronounced over extended periods. Earlier SPIVA summaries reported that 86% of active U.S. equity funds underperformed over 15 years, while 89% of international active funds and 71% of emerging-market active funds also lagged over that horizon. (SPIVA 2025 mid-year report card)
The 2025 result, described as the fourth-worst year for active large-cap managers in scorecard history, extended that pattern rather than breaking it. The implication is process-based: an active mandate needs a clearly defined reason to depart from its benchmark, along with rules for evaluating whether that reason remains valid.
Read categories separately
The evidence should not be reduced to “active always fails” or “active works in overlooked markets.” International and emerging-market results can differ from U.S. large-cap results, yet a category average cannot identify the specific manager, fund, fee structure, or mandate under review.
| Category | Share Beating Benchmark (10Y) | Pattern |
|---|---|---|
| U.S. large-cap equity | Not specified in the verified data | Persistent long-run difficulty relative to the S&P 500 |
| U.S. equity overall | Not specified for 10 years | Earlier 15-year SPIVA summaries showed broad underperformance |
| International equity | Not specified for 10 years | Earlier 15-year summaries showed high underperformance |
| Emerging-market equity | Not specified for 10 years | Earlier 15-year summaries also showed substantial underperformance |
The table leaves the requested 10-year rates unspecified because the verified evidence provided here does not establish precise figures for each category. That restraint improves decision quality. A complete-looking table built on unsupported rates would give an operator less reliable information.
Active management has historically held up differently in some regional and market structures than in U.S. large-cap equity, but category results do not create a forecast. The operator still needs to assess tracking error, fee drag, mandate clarity, manager persistence, and the reason for choosing active exposure. Those checks determine whether active risk serves the written strategy or merely adds discretion.
For individual holdings, the corresponding control is thesis monitoring. An operator can use portfolio drift analysis to identify when the actual book has moved away from its stated allocation or strategy. Historical category evidence can inform that review, but it should not act as a trade signal by itself.
Costs, Fees and the Compounding Gap
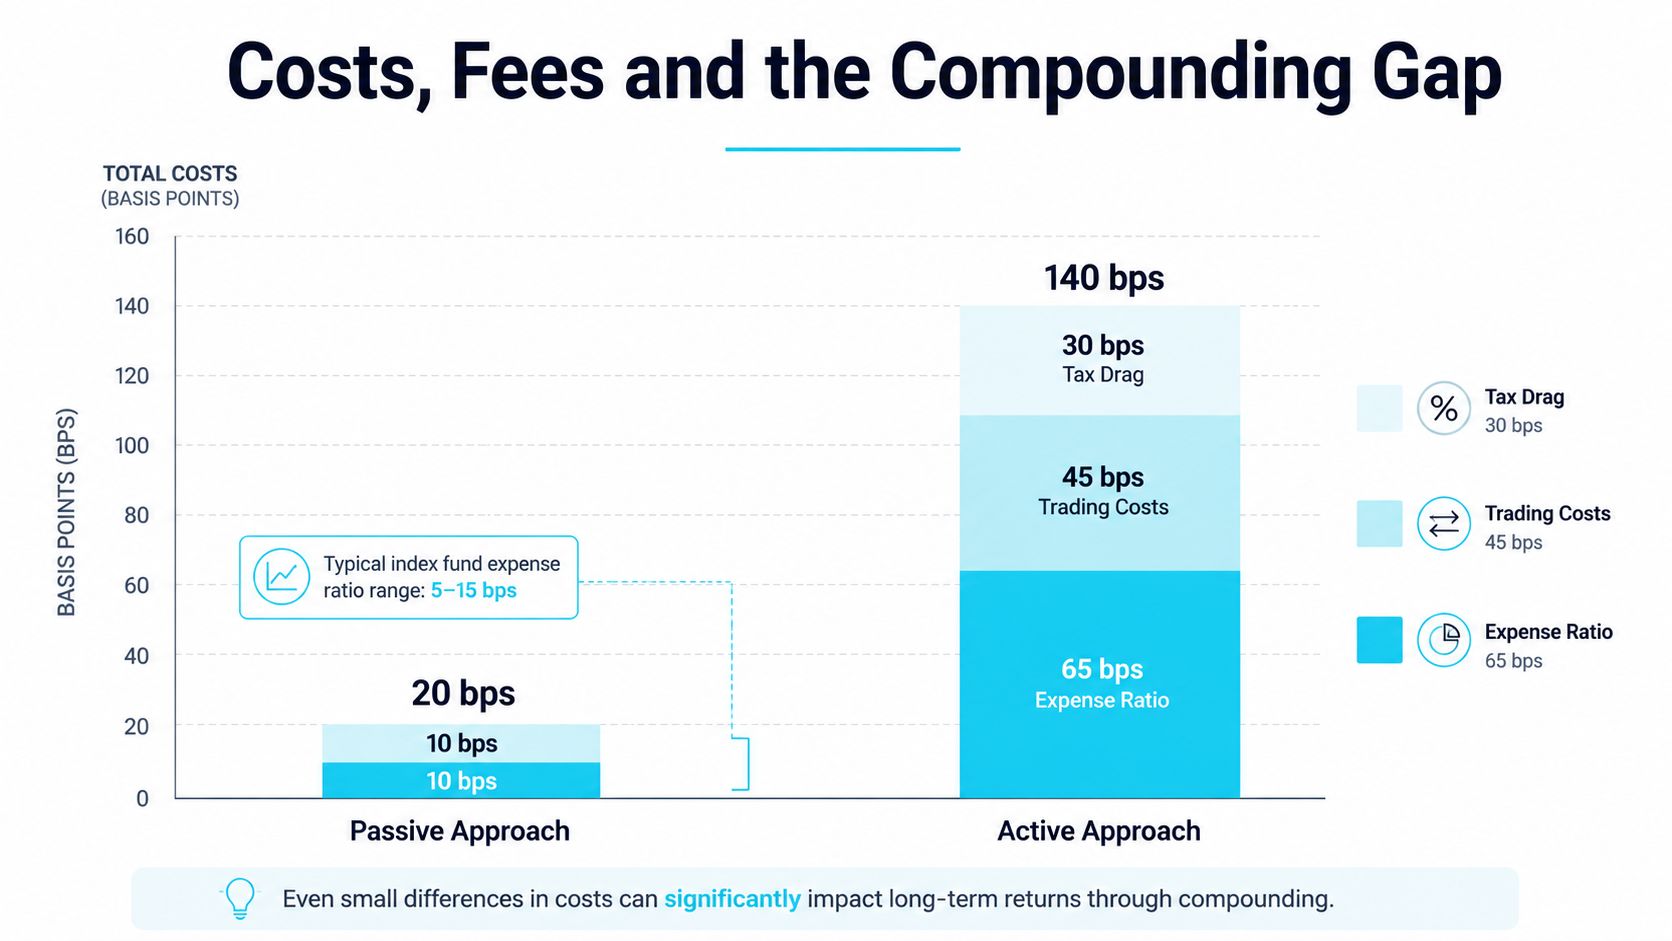
Fees create a hurdle before an active process can justify its additional complexity. SPIVA reports a median ETF fee of 0.45% and a median managed-fund fee of 0.95%, a gap of roughly 50 basis points. (SPIVA by the numbers)
The cost stack extends beyond the management fee:
- Fund expenses: The stated expense ratio pays for administration, management, custody, and related operations.
- Trading friction: Turnover can create commissions, bid-ask spread costs, and market impact.
- Tax effects: Frequent realized gains can complicate taxable accounts, while tax-loss harvesting depends on execution and mandate rules.
- Platform charges: An investment wrapper may add platform or advisory charges that sit outside the fund expense ratio.
The provided cost comparison infographic illustrates a hypothetical passive approach at 20 basis points and active approach at 140 basis points, with separate segments for expense ratio, trading costs, and tax drag. Those figures belong to the visual's scenario, not to a universal fee schedule.
Why the gap changes the job
A cost difference is not a forecast of portfolio results. It is a fixed hurdle embedded in implementation. If two portfolios have identical gross outcomes, the portfolio with higher costs leaves less after those costs, and the difference compounds because each year's deductions reduce the base available for later growth.
A worked compounding example can use a hypothetical 60-basis-point annual cost gap over 20 years, as specified in the scenario. The exact terminal-value difference depends on starting capital and gross growth assumptions, so no single dollar result follows without inventing inputs. The sound conclusion is qualitative: the higher-cost process must create enough value to cover the gap, taxes, and trading friction before its additional work has economic justification.
Cost discipline: Compare the full implementation burden, not just the line labelled expense ratio.
An operator evaluating active exposure should ask what each cost pays for. If the answer is discretionary judgment, research, or downside procedures, those functions need written standards and review evidence. Otherwise, the portfolio can carry active costs while behaving much like an index.
Which Investor Profile Fits Which Approach
Suitability begins with the task assigned to the money. A broad allocation intended to follow a market segment generally fits a passive implementation because the rules are visible, repeatable, and easy to compare with the chosen benchmark.
A passive structure often suits:
- Long-horizon retirement allocation: The operator may prioritize broad exposure and a set-and-review workflow.
- Taxable brokerage account: Lower turnover can simplify the tax workflow, although the actual tax result depends on the account and local rules.
- Core market allocation: The mandate is to represent a broad market segment rather than express a narrow thesis.
An active structure can make sense for a defined sleeve where discretion has a specific purpose. That might include a less-efficient market segment, a factor tilt with explicit rebalance rules, a concentrated theme, or a fixed-income ladder where security selection and maturity planning matter.
Match the wrapper to the work
A thematic sleeve needs more than a theme name. The operator should define the exposure, acceptable concentration, thesis duration, and evidence that would invalidate the idea. A fixed-income workflow needs rules for credit quality, maturity, liquidity, and cash-flow requirements.
The same portfolio can therefore contain different operating models:
| Portfolio task | Potentially suitable process | Oversight question |
|---|---|---|
| Broad market exposure | Passive core | Is the sleeve tracking its intended index and allocation? |
| Concentrated equity thesis | Active sleeve | Does each holding still satisfy the written thesis? |
| Tax-sensitive allocation | Lower-turnover process | Are trades and realized events consistent with the account's constraints? |
| Security-selected bond ladder | Active security selection | Do credit, maturity, and cash-flow rules remain intact? |
The important qualification is process discipline. An active sleeve without written rules can drift into closet indexing, while a passive sleeve without allocation review can drift away from its target role. The label doesn't enforce the mandate. The operator does.
A Hybrid Rule-Based Workflow That Combines Both
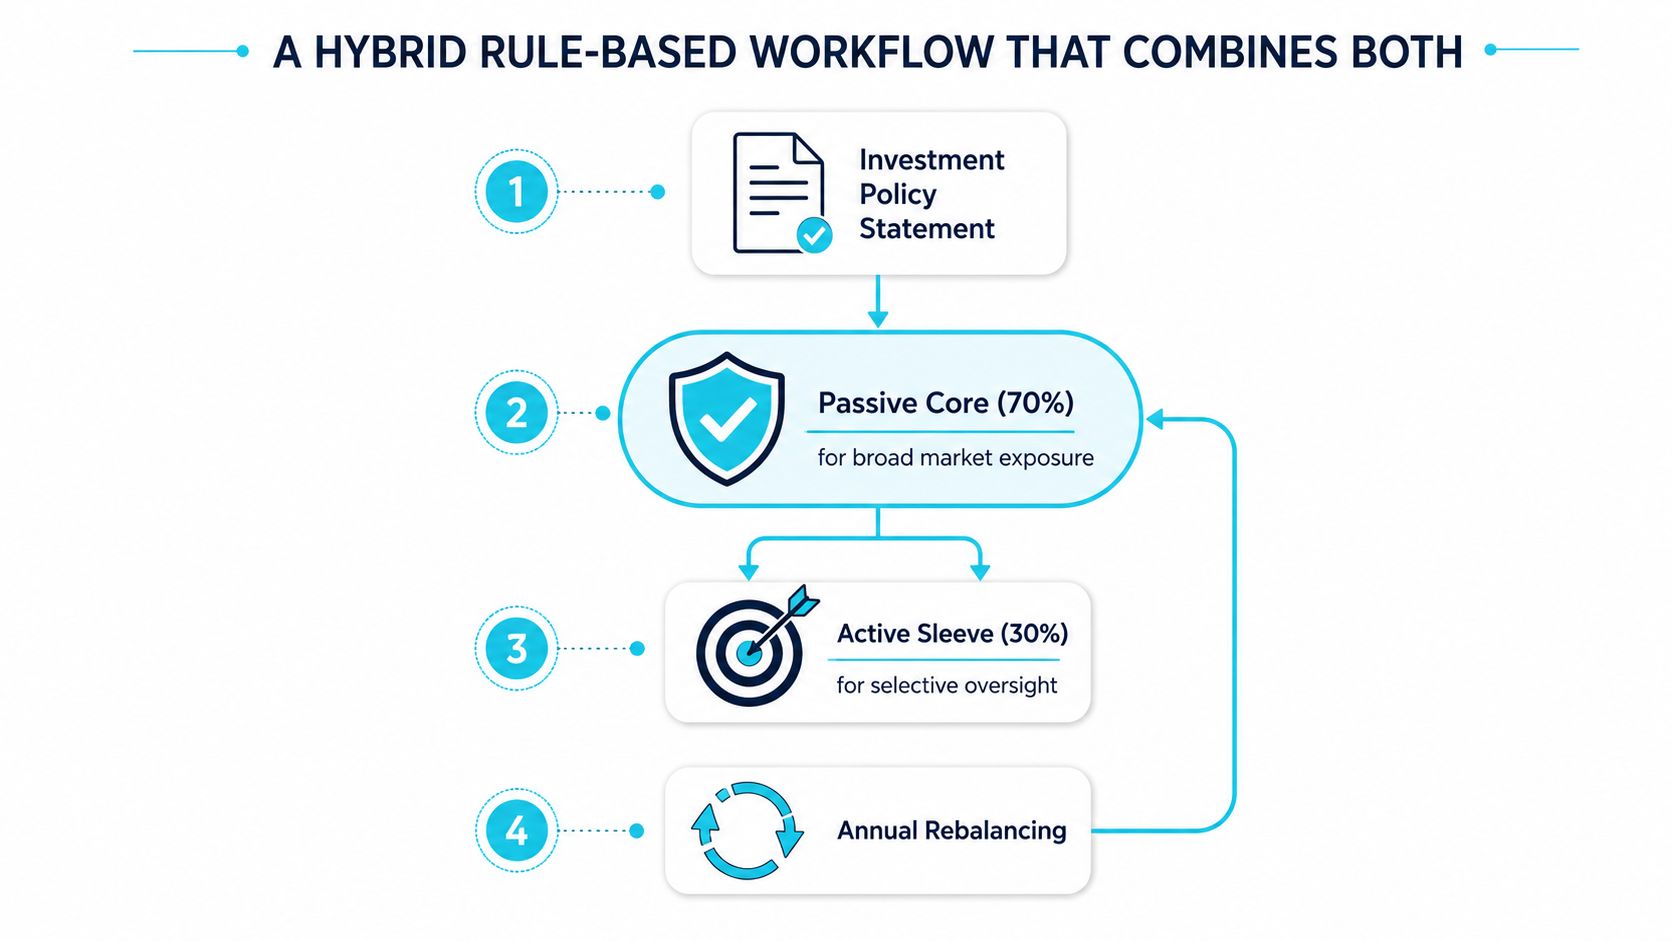
A hybrid portfolio works best when each sleeve has a distinct job. The passive core can provide broad benchmark exposure, while an active sleeve receives closer thesis-level oversight. The split must be written into the investment policy statement, including each sleeve's benchmark, permitted deviations, position constraints, cash treatment, and rebalancing cadence.
Build the workflow in four stages
1. Write the mandate. State why the sleeve exists, what it may hold, and which evidence changes its status. A vague instruction such as “own quality companies” isn't enough. Define quality through checkable financial and business criteria.
2. Separate exposure from conviction. The passive core should be evaluated against its index and allocation role. The active sleeve should be evaluated against its own thesis, benchmark, concentration limits, and tolerance bands.
3. Score thesis fit nightly. Monsa stores an operator's rules and scores each tracked stock against them using deterministic calculations for measurable criteria and AI judgment only where qualitative interpretation is required. It presents the reasoning and separates reported, derived, and missing data, so a score isn't a black box or an automatic trading instruction.
4. Close the documentation loop. Record the review outcome, the evidence considered, and any change to the written thesis. Rebalancing can then follow the stated cadence rather than a reaction to a headline.
Use alerts as review triggers
A thesis-fit score should surface candidates for review, not dictate trades. An operator might investigate a declining margin, a changed balance-sheet condition, a breached position limit, or a mismatch between a holding and its assigned strategy. The decision remains inside the written rule set.
The same principle applies to passive exposure. The operator can monitor allocation drift, benchmark differences, cash balances, and changes in index methodology. A passive fund doesn't need a stock-by-stock thesis, but the overall allocation still needs a documented purpose.
The deeper synthesis is that passive and active aren't opposing philosophies at every level. Passive implementation can handle the broad exposure problem efficiently. Active oversight can handle the conviction problem, but only where the operator can articulate and police a specific reason for deviation. The rules-based investing framework is useful here because it turns the debate from a product choice into a repeatable operating process.
Frequently Asked Questions About Active and Passive Investing
Can passive lose to itself?
Yes. A passive fund can differ from its benchmark because of fees, cash, sampling, trading conditions, and implementation choices. The relevant review is tracking difference and mandate fit, not an assumption that every index vehicle behaves identically.
How does rebalancing frequency affect tracking error?
More frequent intervention can reduce allocation drift but can also create additional trading and tax activity. Less frequent intervention may leave weights farther from target. The appropriate cadence depends on the written tolerance band and the cost of acting.
Why do index inclusion rules matter?
Index methodology can affect sector concentration, constituent eligibility, and reconstitution activity. Operators need to understand what the index includes rather than treating “passive” as synonymous with broad diversification.
When do active funds shut down?
Funds can close, merge, or change mandate when assets, demand, or commercial viability no longer support the structure. An operator should monitor continuity and mandate changes rather than assume a fund's process is permanent.
Should the split change as portfolio size grows?
Portfolio size can change liquidity needs, tax considerations, cash-flow requirements, and the practicality of concentrated positions. The allocation should change only when those constraints and the written policy change, not because a headline favors one label.
Monsa helps operators compare their holdings with the rules they wrote, using transparent scoring, per-criterion reasoning, and nightly refreshes rather than trade instructions. Visit Monsa to see how a strategy-versus-portfolio workflow can support disciplined oversight across active sleeves and passive allocations.
Monsa is a portfolio-analysis tool, not a broker or investment adviser. Nothing here is investment advice.
// related reading
What Is Portfolio Turnover and Why It Matters
What is portfolio turnover? Learn the SEC formula, worked examples, costs, taxes and benchmarks to judge if trading fits your strategy.
Watchlist Management: A Step-by-Step Guide for Traders
Master watchlist management with actionable steps to create, score, and prioritize your stock list. Learn thesis alignment and alerts setup for better
Florida Unemployment Amount: What You Will Actually Receive
Learn how the Florida unemployment amount is calculated, the $275 weekly cap, duration rules, and how partial earnings change your payment in 2026.
7 / 100 founding seats claimed - $100/yr locked, then $190/yr
Monsa is a portfolio-analysis tool, not a broker or investment adviser. It never recommends what to buy or sell - it checks what you hold against rules you wrote. Nothing here is investment advice.