// blog
Dividend Growth Investing Strategy: Rules That Work
Dividend growth is often treated like a yield screen, but the deeper signal is payout durability. The S&P 500 Dividend Aristocrats only admit companies that have increased total dividend per share every year for at least 25 consecutive years, and S&P Dow Jones Indices says the index's annualized dividend growth rate has been 8.1% since launch, compared with about 2.6% CPI inflation over the same period (S&P Dow Jones Indices). That gap is why dividend growth investing is better understood as a real-income strategy than a simple hunt for headline yield.
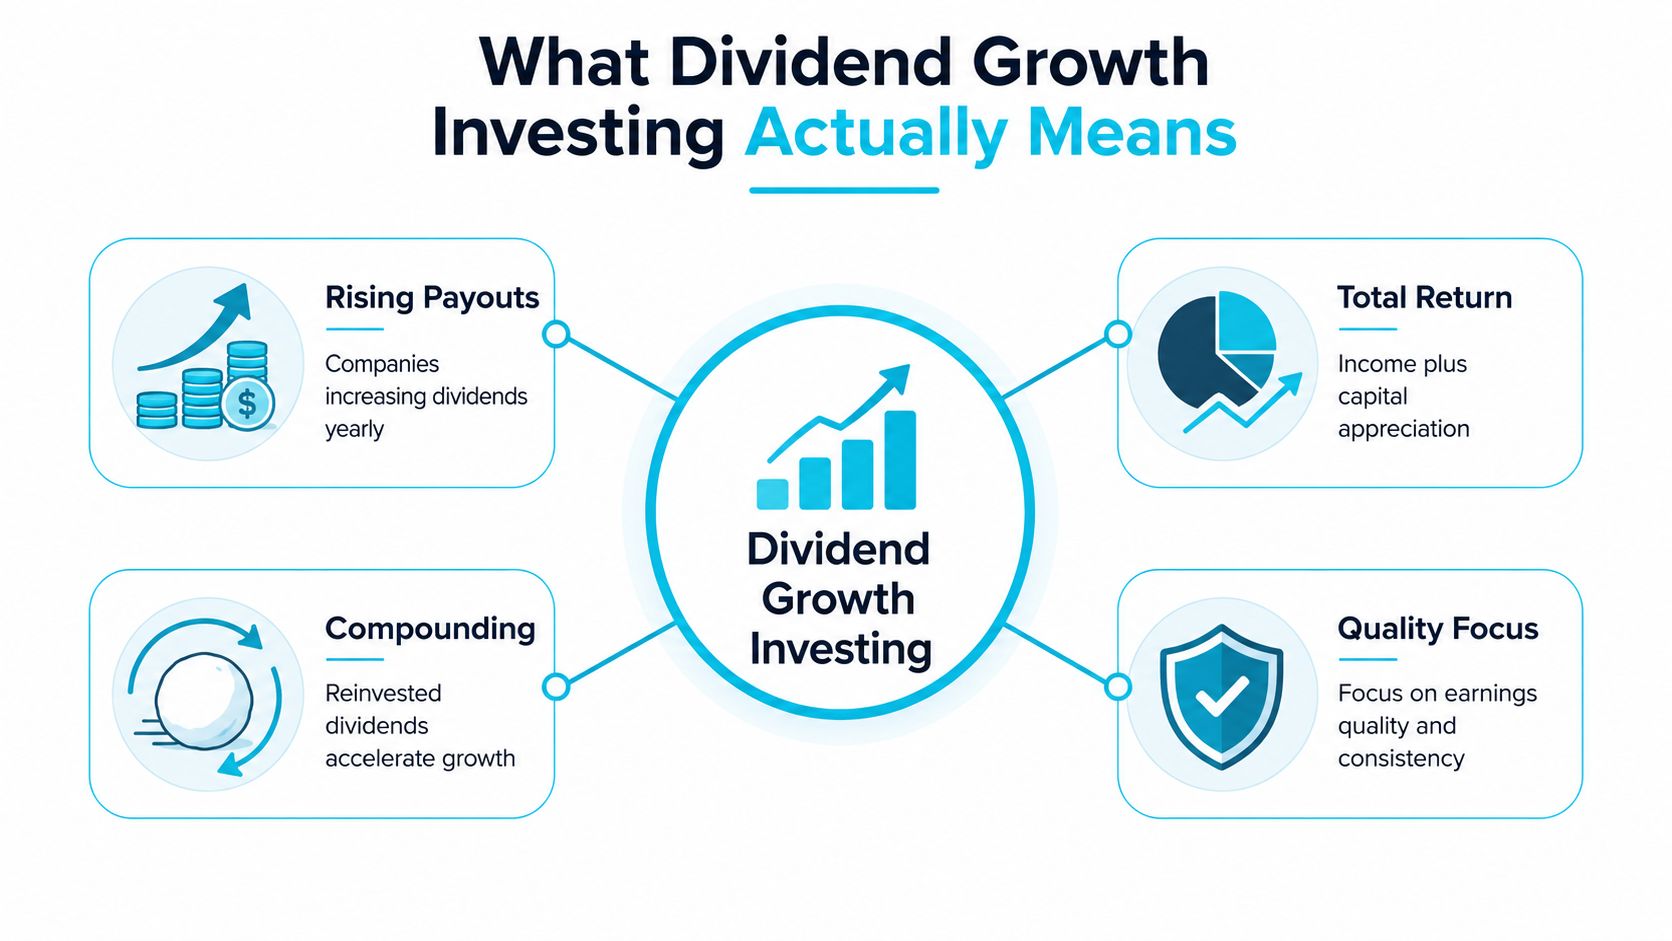
Table of Contents
- What Dividend Growth Investing Actually Means
- Three pillars matter more than yield
- Why Dividend Growth Matters and How the Aristocrats Standard Took Shape
- How the Aristocrats idea became a durability test
- What the methodology actually checks
- Core Selection Criteria Investors Build Their Rules Around
- The table below shows what each rule is trying to catch
- Why thresholds need to work together
- A Step-by-Step Workflow for Evaluating a Dividend Growth Candidate
- Stage one and two, history and coverage
- Stage three and four, yield and cash conversion
- Stage five, fit and concentration
- What a Long Streak Hides and Why Free Cash Flow Coverage Matters More
- The real test is cash after reinvestment
- Why a written override rule helps
- Inflation, Sector Concentration, and the Real Income Question
- The inflation hedge is conditional
- Sector concentration changes the answer
- Turning Your Strategy Into a Nightly Thesis Check
- The nightly loop is the discipline
- Qualitative judgment still has a place
- Putting the Full Rule Set Together and Reviewing It on a Schedule
- A practical cadence keeps the process honest
What Dividend Growth Investing Actually Means
Dividend growth investing is built around a simple idea, companies that can keep raising payouts tend to reveal something useful about their business quality. The point is not to own the highest-yield names in a screen. The point is to own businesses that can keep increasing the cash they send to shareholders, year after year, without straining the balance sheet or starving the business of reinvestment.
Three pillars matter more than yield
The first pillar is consecutive dividend increases, because a record of raises says management has had enough stability, cash generation, and capital discipline to keep the streak alive. The second is a payout ratio that leaves breathing room, because a dividend can only compound if there's space for it to grow without running into earnings pressure. The third is free cash flow coverage, because accounting profits alone don't pay distributions, cash does.
Practical rule: A dividend growth strategy is only as good as the cash behind it.
That's why a lower-yield stock can still be the more serious income compounder. If a company starts with a modest payout but grows it steadily, the income stream can become much more meaningful over time, especially when dividends are reinvested. The math works because the investor owns more shares over time, and each raise lands on a larger base.
For readers who want the basics of current yield versus dividend growth, the distinction is laid out clearly in Monsa's dividend yield guide. Yield tells you what's paid today. Dividend growth tells you whether that income stream has room to stay alive and expand.
Why Dividend Growth Matters and How the Aristocrats Standard Took Shape
The cleanest case for dividend growth is historical, not theoretical. Lord Abbett says that over the 50-plus-year period from January 1973 through December 2025, dividend growers in the S&P 500 delivered higher annualized returns with lower volatility than dividend payers that did not grow dividends, dividend non-payers, and dividend cutters (Lord Abbett). That doesn't make the outcome automatic, but it does explain why investors keep using dividend growth as a quality filter.
How the Aristocrats idea became a durability test
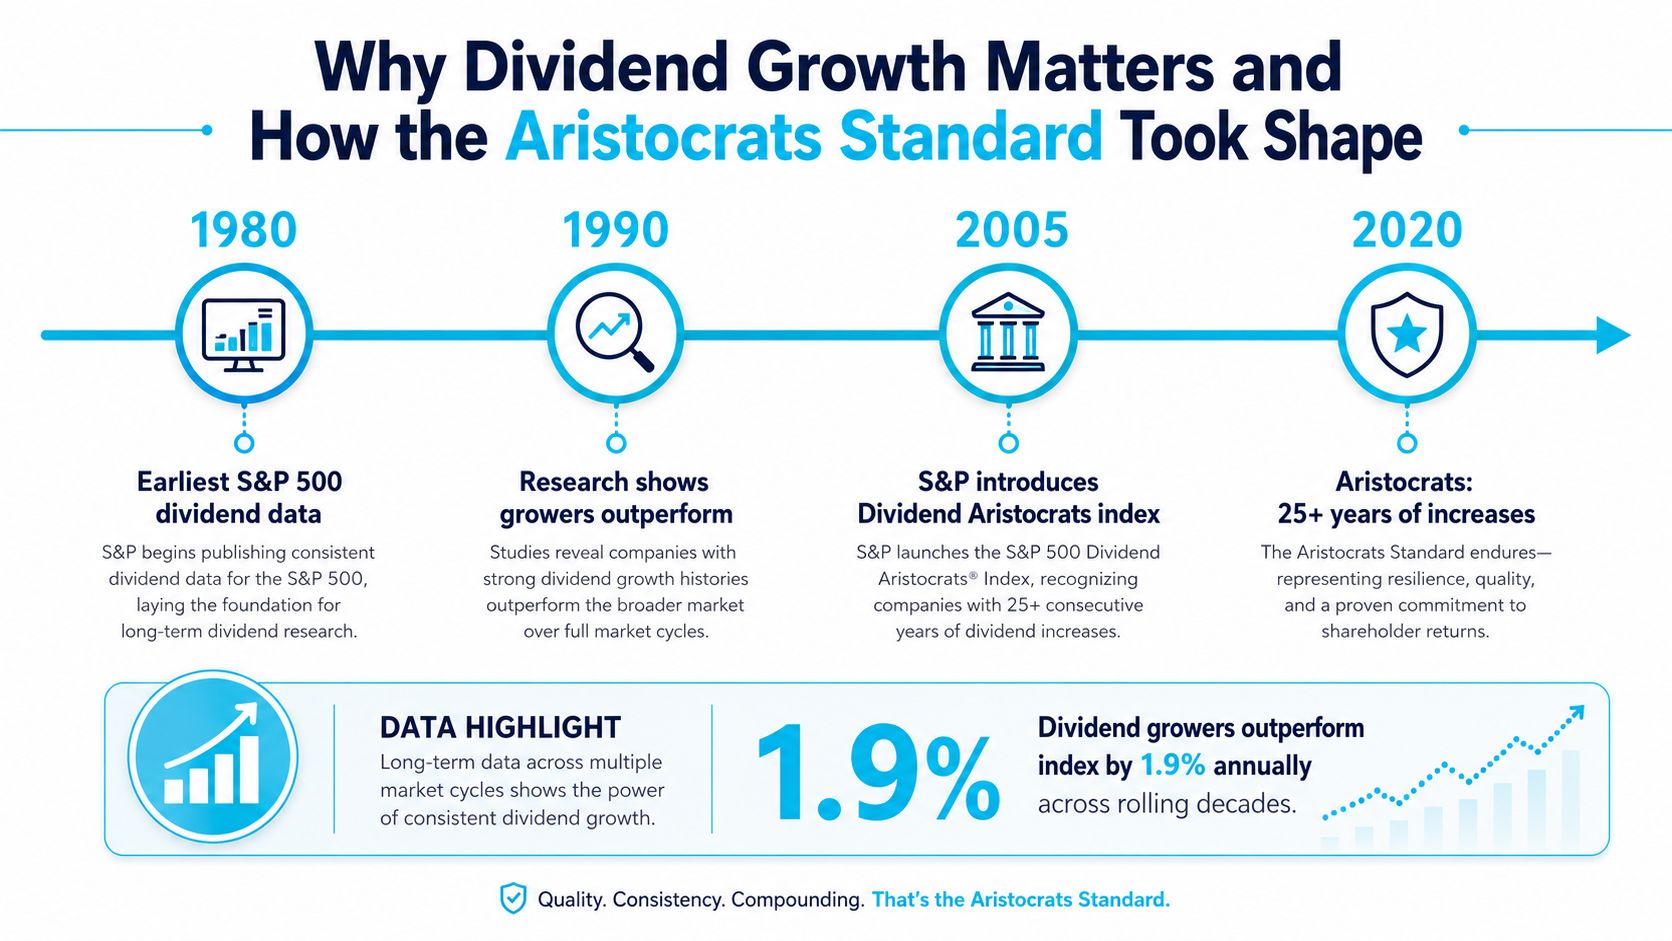
S&P's Dividend Aristocrats concept began in its early-1980s Outlook publication with a 10-year minimum, then shifted to the 25-year standard in late 2002, which was a deliberate move toward a tougher durability proxy (S&P Dow Jones Indices). The first iteration of the list appeared in January 2003, and the index itself launched on May 2, 2005 (S&P Dow Jones Indices).
That history matters because the standard measures a streak, not a promise. A long record of raises shows consistency in capital allocation, but it does not prove that the next raise will be easy, cheap, or fully covered by current cash generation. The streak is a filter, not a conclusion.
What the methodology actually checks
The index is equal-weighted and includes only S&P 500 companies that have increased total dividend per share every year for at least 25 consecutive years (S&P Dow Jones Indices). It also adds hard screens like a minimum float-adjusted market cap of USD 3 billion, average daily value traded of at least USD 5 million over the prior three months, and a minimum constituent count of 40 at each rebalancing (Sure Dividend summary of S&P methodology).
If fewer than 40 names qualify, the methodology relaxes the inclusion rules and selects non-constituents with more than 20 consecutive years of dividend increases, ranked by dividend yield until the minimum count is met (S&P Dow Jones Indices methodology). That tells you the list is designed to be investable and durable, but it still needs a second layer of analysis from the portfolio owner.
Core Selection Criteria Investors Build Their Rules Around
A useful dividend growth screen is never a single-number test. It's a stack of checks that catch different failure modes, because one metric can look fine while another is deteriorating. The best rules are written down in advance, so the same standard gets applied to every holding instead of changing with sentiment.
The table below shows what each rule is trying to catch
| Criterion | Typical Threshold | What It Catches | Companion Check |
|---|---|---|---|
| Dividend increase streak | 10 years or more | Interruptions in capital allocation discipline | Payout sustainability |
| Dividend growth rate | 5% or more over 5 years | Stagnant or token raises | Earnings trend |
| Payout ratio | Below 65% | Room for future raises | Free cash flow coverage |
| Earnings growth | Positive over trailing 5 years | Dividends that may outrun business growth | Cash conversion |
| Debt-to-equity | Below 1.5 | Balance-sheet stress | Interest coverage and cash flow |
| Free cash flow coverage | Dividend funded after reinvestment | Distribution pressure from capex or working capital | Payout ratio |
The structure above lines up with a neutral screening guide that uses 10 consecutive years of dividend increases, a 5-year dividend growth rate of 5% or more, a payout ratio below 65%, positive earnings growth over the trailing 5 years, and debt-to-equity below 1.5 (DividendRanks). Those are not magic numbers. They're practical tripwires that tell you whether the company has enough financial slack to keep compounding payouts.
Why thresholds need to work together
A low payout ratio can still mislead if free cash flow is being consumed by capital spending or working capital. A long streak can still survive while the business is getting stretched. A decent earnings trend can still fail to translate into spendable cash.
Research on dividend growth forecasting found that adjusted earnings yield had substantial out-of-sample predictive power, with out-of-sample R2 of 25% at a one-month horizon and 35.45% at a 15-month horizon (ScienceDirect). That supports a straightforward analyst's conclusion, earnings power matters because it helps explain whether a dividend can keep growing without becoming detached from the business underneath it.
A Step-by-Step Workflow for Evaluating a Dividend Growth Candidate
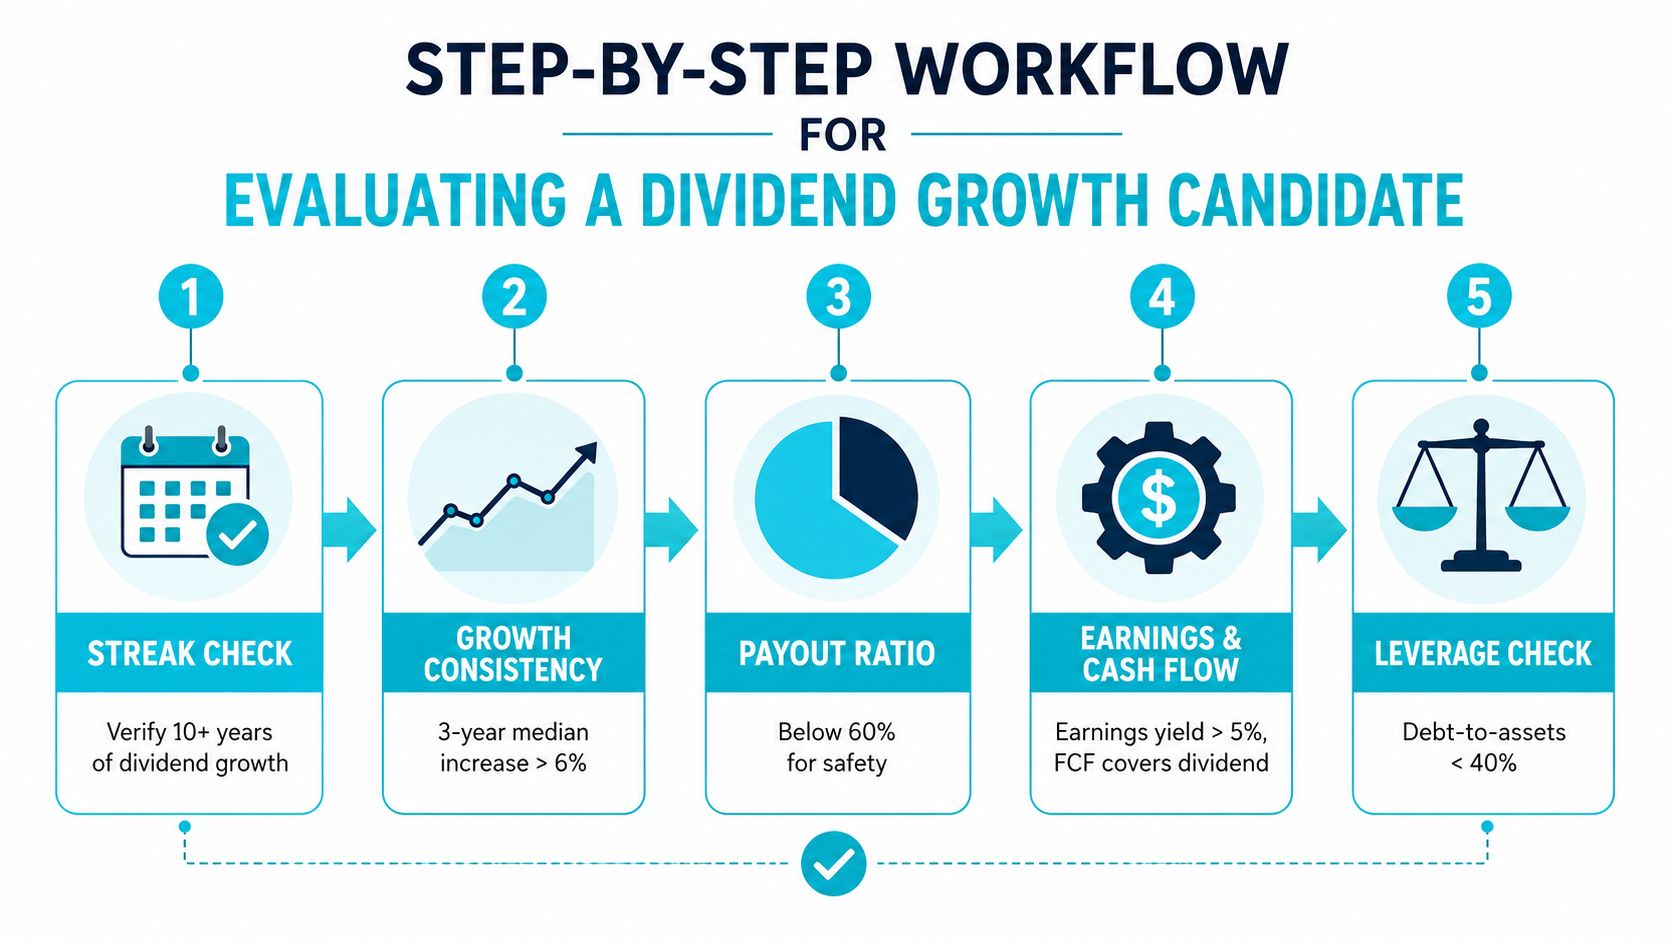
A candidate process works best when it's repetitive. The order matters, because each stage should answer a different question and eliminate a different type of false positive. Streaks can screen for persistence, payout ratios can screen for room to grow, and cash flow can screen for actual funding.
Stage one and two, history and coverage
First, verify the dividend growth streak and check the recent pattern of increases. A streak of 10 years or more is the kind of signal that separates routine payers from businesses with a real commitment to the dividend policy. Then compare the payout ratio across operating earnings and free cash flow, because a company can look safe on paper while paying out too much of what it generates.
Stage three and four, yield and cash conversion
Next, layer in a yield floor for book candidates. A sub-2% starting yield can still be acceptable in some frameworks, but it forces the growth engine to do almost all the work, so the screen needs to reflect that tradeoff. After that, inspect capex intensity and working-capital drag on free cash flow after dividends, because those are the costs that can turn a seemingly stable payout into a tightening squeeze.
Stage five, fit and concentration
The last check is portfolio fit. Sector concentration, size exposure, and overlap with existing holdings matter because a dividend strategy can drift into a narrow set of industries if the screen is too loose. A pass, watch, or reject verdict is more useful than a vague opinion, because it can be tracked against the written thesis and revisited later.
A useful rule is to treat every candidate as guilty of one hidden weakness until cash flow, leverage, and payout history prove otherwise.
For a broader framework on reading filings, margins, and balance-sheet clues, Monsa's stock analysis guide fits naturally into the same workflow.
<iframe width="100%" style="aspect-ratio: 16 / 9;" src="https://www.youtube.com/embed/BGdc9xRPedY" frameborder="0" allow="autoplay; encrypted-media" allowfullscreen></iframe>
What a Long Streak Hides and Why Free Cash Flow Coverage Matters More
A long dividend streak can create false comfort. Kimberly-Clark's 2025 dividend payout ratio reached 101.3% of free cash flow after major transformation spending, which means the dividend was effectively being funded beyond core cash generation (AInvest). That is the kind of case that shows why a streak is not the same thing as funding quality.
The real test is cash after reinvestment
A dividend is resilient only when the business can fund it after maintenance capex, growth capex, and the working-capital needs of the enterprise. If the company has to lean on debt, asset sales, or one-time items to keep the streak alive, the record may survive for a while even as the underlying economics weaken. That's why free cash flow coverage should sit above streak length in the decision order.
The practical calculation is straightforward. Start with operating cash flow, subtract capital expenditures, and then compare the remaining free cash flow against dividends paid. If the margin gets thin or negative, the dividend may still be declared, but the stress is showing up where it matters.
Why a written override rule helps
A useful red flag is simple, if free cash flow after reinvestment doesn't cover the distribution with room to spare, the streak loses decision weight fast. That doesn't mean a company must be discarded immediately, but it does mean the portfolio owner needs a different level of scrutiny. The key is to force the cash flow question to overrule the comfort of a long streak.
The point is not that every long-streak company is fragile. The point is that some streaks are funded by room to maneuver, while others are funded by accounting convenience and temporary balance-sheet support. The screen should distinguish those two cases, because they can look similar until the pressure rises.
Inflation, Sector Concentration, and the Real Income Question
Dividend growth only protects purchasing power if the dividend stream grows faster than the prices the investor pays for goods and services. S&P notes that from 2000 to 2023, constituents of the S&P High Yield Dividend Aristocrats grew their dollar dividends at a 5.18% compound annual growth rate, while CPI inflation ran at 2.51% over the same span (S&P Dow Jones Indices). That spread explains why dividend growth can preserve real income in some regimes, but not all.
The inflation hedge is conditional
Recent commentary has highlighted inflation as a key test for dividend portfolios and has pointed investors toward dividend growth history rather than yield alone (Forbes). The important caveat is that dividend growth is not an automatic hedge. If dividend growth slows, or if a portfolio is concentrated in slower-growing sectors, the income story gets weaker even when the yield looks steady.
A practical way to think about the problem is to compare dividend growth with inflation across rolling periods, not in a single headline year. When dividend growth stays ahead of inflation, the investor's purchasing power can improve. When it falls behind, the portfolio may still look income-oriented while losing ground in real terms.
Sector concentration changes the answer
Dividend growth portfolios often cluster in sectors with durable cash flows, which is useful until it becomes overconcentration. Independent commentary has also noted pressure from earnings weakness, margin compression, and sector concentration, all of which can slow future dividend increases and reduce growth optionality. That is why a dividend growth screen should always ask whether the holdings have enough earnings diversity to support continued raises.
| Period | Dividend CAGR | Avg CPI | Real Return |
|---|---|---|---|
| 2000 to 2023 | 5.18% | 2.51% | Positive in nominal-growth terms, with room above inflation (S&P Dow Jones Indices) |
Turning Your Strategy Into a Nightly Thesis Check
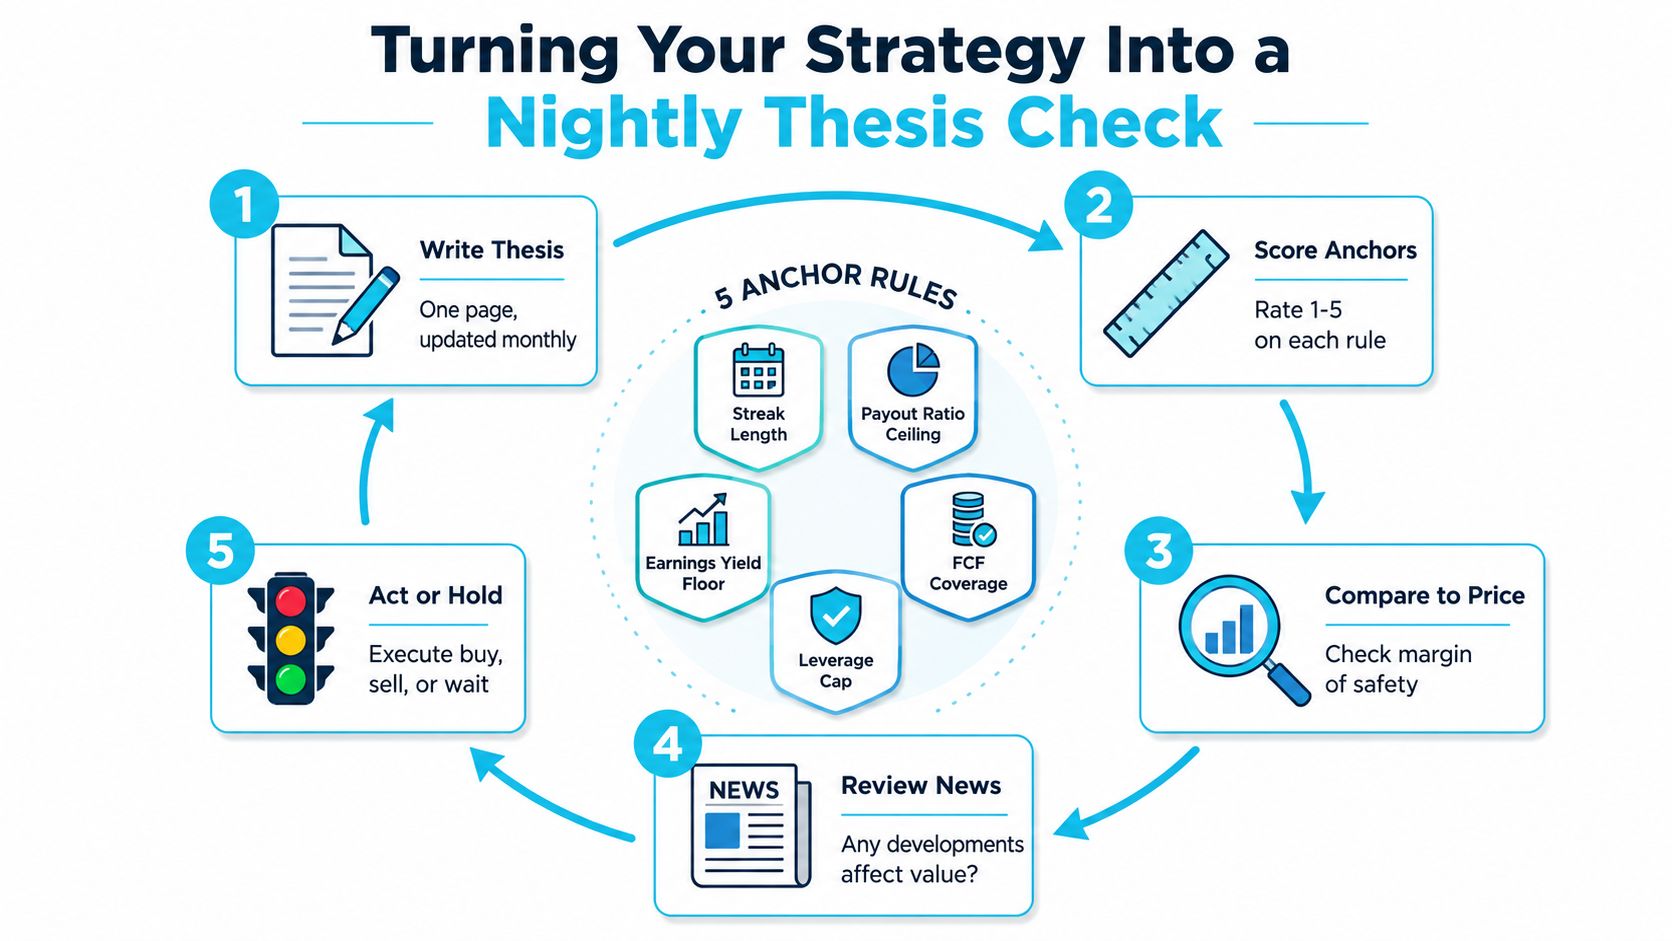
A dividend growth strategy becomes much stronger when it's written as a thesis and checked the same way every night. Monsa is one tool that stores an investor's rules, scores each tracked stock against those rules nightly, and shows whether the holding still fits the written thesis. That matters because dividend growth drift usually starts slowly, with payout ratios rising, debt levels creeping up, or cash coverage tightening before the price chart makes the problem obvious.
The nightly loop is the discipline
The written thesis should name the five anchor rules, streak length, payout ratio ceiling, earnings yield floor, free cash flow coverage, and debt limit. Each night, the book gets re-scored against those same anchors, and any breach is logged as a change in fit rather than a market opinion.
That makes the process less emotional. Instead of asking whether a stock feels expensive or safe on a given day, the operator asks whether the facts still match the rules that were set in the first place. The nightly refresh also surfaces slow changes early, which is exactly where dividend growth mistakes tend to hide.
Qualitative judgment still has a place
Not everything in the thesis can be reduced to a single ratio. Some developments need judgment, especially when capital allocation changes, a major restructuring begins, or free cash flow gets distorted by temporary spending. Monsa separates deterministic rules from qualitative judgments, so the review can show its work instead of burying it.
Useful standard: If a rule can be written clearly, it should be checked the same way every time.
For a rules-first framework that matches this approach, Monsa's rules-based investing page fits the same discipline. The broader idea is simple, a dividend growth book works best when the thesis is visible, the scoring is repeatable, and the review happens before the drift becomes a problem.
Putting the Full Rule Set Together and Reviewing It on a Schedule
A complete dividend growth process combines the streak, the payout ratio, the earnings trend, the free cash flow test, and the debt check into one written standard. That standard should be reviewed on a fixed cadence, not when the mood changes. Nightly checks catch drift, monthly reviews catch outliers, quarterly audits catch portfolio-wide shifts, and an annual strategy review tests whether the rules still match the inflation and concentration reality.
A practical cadence keeps the process honest
| Rule Category | Review Frequency | Trigger Threshold | Required Output |
|---|---|---|---|
| Dividend streak | Nightly | Any break in consecutive increases | Flag for review |
| Payout ratio | Nightly | Crossing 70% | Re-score and note cause |
| Free cash flow coverage | Nightly | Dividend no longer covered after reinvestment | Watch or reject |
| Leverage | Quarterly | Material deterioration from prior check | Thesis update |
| Inflation check | Annually | Dividend growth lagging CPI over the review window | Strategy revalidation |
The trigger points matter more than the calendar. A streak break at any holding should force an out-of-cycle revision. So should a payout ratio that crosses 70%, because that usually means the margin for future raises is getting thinner than the original thesis assumed.
The annual review should compare the portfolio's dividend growth history with inflation and sector concentration, then decide whether the thresholds still make sense. That's the point of a living strategy document, it changes because the facts changed, not because sentiment did. If you want a dividend growth strategy that stays disciplined after the first screen, visit Monsa and see how a written thesis can be checked against every holding each night.
Monsa is a portfolio-analysis tool, not a broker or investment adviser. Nothing here is investment advice.
// related reading
What Is Portfolio Turnover and Why It Matters
What is portfolio turnover? Learn the SEC formula, worked examples, costs, taxes and benchmarks to judge if trading fits your strategy.
Watchlist Management: A Step-by-Step Guide for Traders
Master watchlist management with actionable steps to create, score, and prioritize your stock list. Learn thesis alignment and alerts setup for better
Florida Unemployment Amount: What You Will Actually Receive
Learn how the Florida unemployment amount is calculated, the $275 weekly cap, duration rules, and how partial earnings change your payment in 2026.
7 / 100 founding seats claimed - $100/yr locked, then $190/yr
Monsa is a portfolio-analysis tool, not a broker or investment adviser. It never recommends what to buy or sell - it checks what you hold against rules you wrote. Nothing here is investment advice.