// blog
How to Evaluate Stocks with a Rules-Based Workflow
You've probably had the same experience many investors do. You open a stock screen, see a low P/E, then notice the balance sheet, then wonder whether the business is any good, and by the end you're still not sure if the stock deserves capital. That's not a knowledge problem, it's a process problem. How to evaluate stocks gets much easier when you stop treating ratios like disconnected clues and start using a repeatable workflow that moves from business model, to financial quality, to valuation, and then to the judgments numbers cannot settle.
Table of Contents
- Why Most Stock Evaluation Routines Fall Apart
- The Four-Stage Evaluation Sequence
- Stage 1, Understand the business model
- Stage 2, Check financial quality
- Stage 3, Judge the valuation
- Stage 4, Layer in qualitative judgment
- Financial Quality Checks That Matter
- Look for multi-year consistency, not one good year
- Cash flow and leverage tell you whether the story is real
- Valuation Benchmarks That Work Better Than a Single Multiple
- Use multiple lenses, not one screen
- Know when a premium multiple is justified
- Ask the question the market is answering
- Qualitative Factors You Still Have to Judge
- Judge the moat and the management separately
- Put qualitative judgment on a simple scale
- Turning the Workflow Into a Scored Rule Set
- Write the rules before you look at the stock
- Pre-Purchase Checklist and Common Traps to Avoid
Why Most Stock Evaluation Routines Fall Apart
An investor who changes the order every night ends up with no durable record of what mattered. One evening the stock looks attractive because the P/E is low, the next it looks risky because debt is high, and a week later it gets treated like a story because the business sounds exciting. The decision keeps shifting because the starting point keeps shifting.
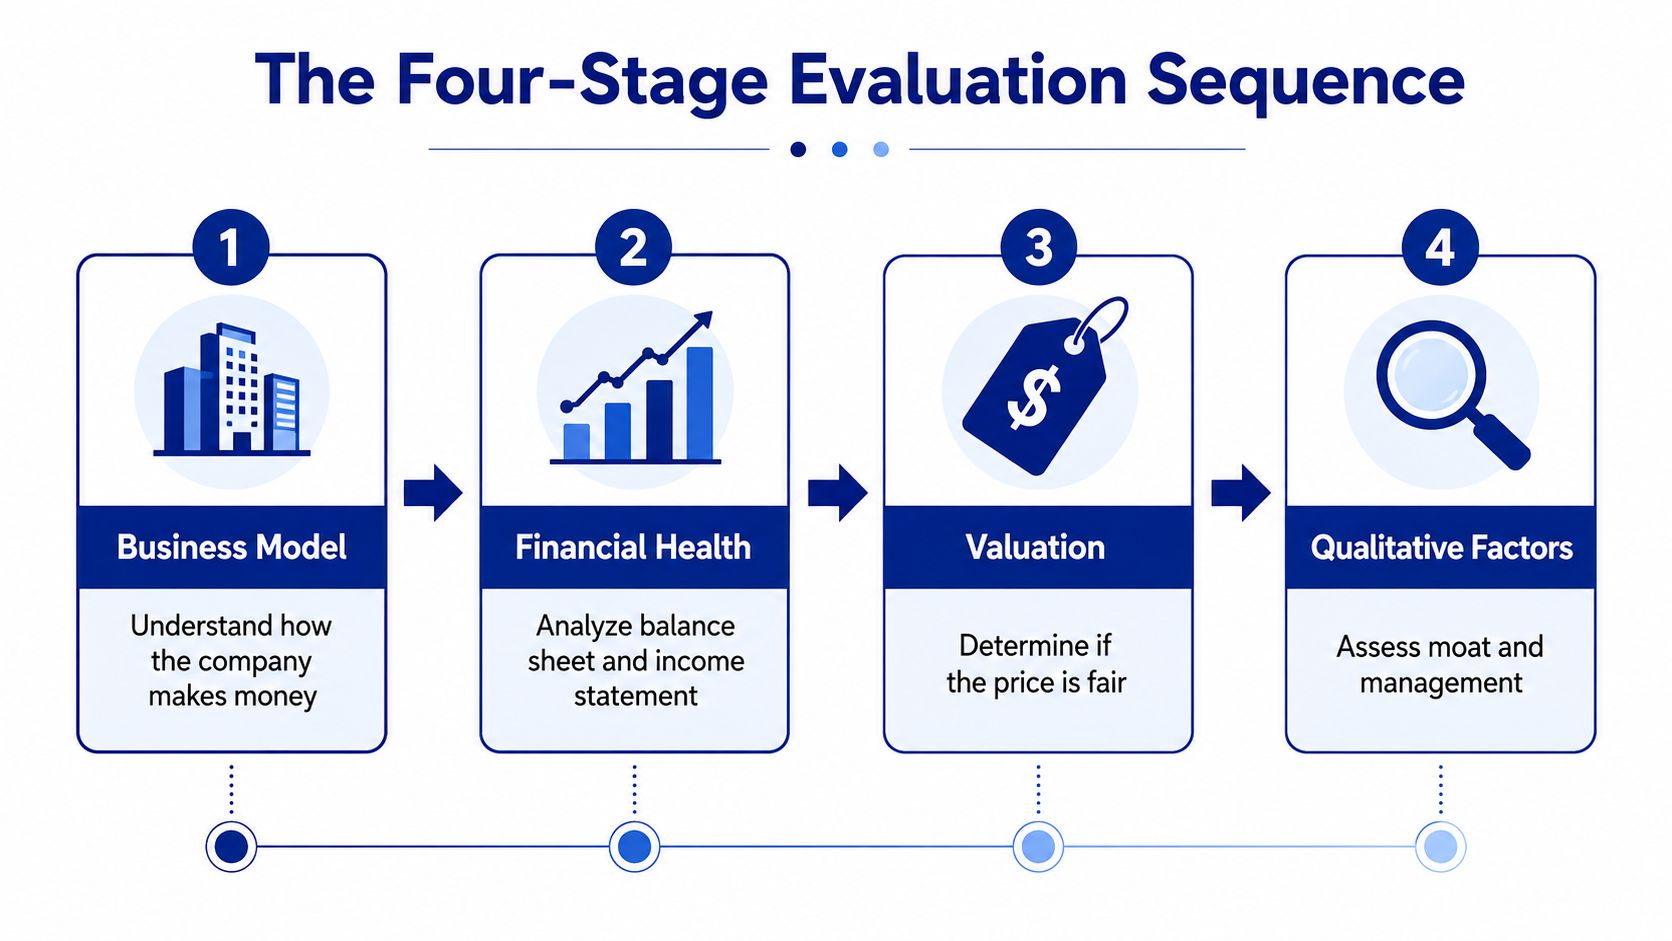
A better routine starts by fixing the sequence before looking at any single ratio. Business first. Financial quality second. Valuation third. Qualitative judgment last. That order matters because a metric only becomes useful after you know what the company does, whether the business has shown it can create value over time, and whether the market price already reflects those traits.
FINRA's stock evaluation guidance makes the same point in direct terms. It defines EPS as earnings divided by shares outstanding, P/E as the stock price divided by EPS, P/S as a useful measure when a company is not yet profitable, and D/E as a measure of how much debt supports the operation. The metric only answers a useful question when you know the business context behind it. A P/E of 25 is more expensive on earnings than a P/E of 20 because investors are paying more for each dollar earned, but that comparison only matters after you have decided that the earnings are real, repeatable, and worth paying for. FINRA's stock evaluation guide
Practical rule: If you cannot write one sentence explaining how the company makes money, you are not ready to value it.
The fastest way to improve the process is to stop asking, “Is this stock cheap?” and start asking, “Cheap compared with what, and tied to which part of the business?” That question forces discipline. It also helps you avoid treating a weak business at a low multiple as value.
The Four-Stage Evaluation Sequence
Stage 1, Understand the business model
Start with the business itself. FINRA recommends checking how the company makes money, whether its products are in demand, whether management is experienced, and how the industry is doing overall. Fidelity adds that analysis should begin with trends in earnings, revenue, and debt, then account for external forces such as inflation and interest rates before you decide whether the stock fits your goals. FINRA's stock evaluation guide, Fidelity's stock analysis guide
That first step sounds basic, but it's where many bad calls begin. A retailer, a software company, and a bank may all trade on a “cheap” multiple, but the reasons they deserve that multiple are completely different. The business model tells you whether you should care more about margins, asset intensity, recurring revenue, credit losses, or reinvestment needs.
Stage 2, Check financial quality
Once the model is clear, test whether the numbers show durable economics. Professional research guides consistently emphasize multi-year revenue and EPS trends, operating cash flow versus net income, gross and operating margin stability, and balance-sheet strength such as debt-to-equity, current ratio, and interest coverage. TickerDaily's fundamental analysis guide
This step separates businesses that are compounding from businesses that are only temporarily polished. A company can look attractive on one or two quarterly reports and still fail this test if cash conversion is weak, debt is climbing, or margins are deteriorating. The point is not to chase perfect numbers. The point is to see whether the company keeps its footing across more than one cycle.
Stage 3, Judge the valuation
Valuation comes after quality, not before it. That order prevents you from mistaking a low multiple for a good deal. FINRA's explanation of P/E, P/S, and the use of borrowed money is useful here because it reminds you that ratios compare the stock price with a business reality, not with a headline. FINRA's stock evaluation guide
Stage 4, Layer in qualitative judgment
The final layer is judgment. Some things are visible in filings and earnings calls, but not reducible to a neat ratio. A stock can clear the numbers and still fail because the moat is weak, the industry is crowded, the customer base is concentrated, or management allocates capital poorly. That's where the written thesis matters, because it keeps you from turning a nice-looking spreadsheet into an impulsive decision.
The sequence works because each stage answers a different question. The business model tells you what you're reviewing. The financials tell you whether the machine works. Valuation tells you what the market is charging. Qualitative judgment tells you whether the edge is durable enough to hold up through noise.
Financial Quality Checks That Matter
Look for multi-year consistency, not one good year
The cleanest signals are rarely the flashiest. A good screening process starts by tracking earnings, revenue, and debt over several periods, then checking whether those trends still make sense after you account for rates and inflation. A company with rising revenue but erratic earnings deserves more scrutiny than a company with slower growth and steadier conversion.
Long-run return measures such as ROE, ROIC, and ROCE help you judge whether management has created economic value through different market environments. No single ratio deserves worship, but a credible history of using capital well matters. When those measures stay durable, the business has usually earned the right to keep compounding.
Cash flow and leverage tell you whether the story is real
Operating cash flow should not be treated as a side note. If net income looks strong but cash keeps lagging, the quality of those earnings is questionable. That gap often appears in businesses that rely on aggressive accruals, loose working capital, or accounting choices that flatter the income statement more than the cash account.
Balance-sheet checks matter for the same reason. Debt-to-equity, current ratio, and interest coverage show whether the business can absorb pressure without turning to the market or cutting operating flexibility. A company with high debt can still be investable, but that debt should be a conscious choice, not a surprise.
| Ratio | What It Measures | Healthy Range | Red Flag |
|---|---|---|---|
| Revenue trend | Top-line growth over time | Steady, explainable growth | Growth that stalls without a clear reason |
| EPS trend | Profitability per share | Consistent improvement over time | EPS that rises from financial engineering rather than business strength |
| Operating cash flow vs net income | Earnings quality and cash conversion | Cash flow keeps pace with earnings | Net income rises while cash flow lags badly |
| Gross margin | Pricing power and cost control | Stable or improving | Sharp erosion without a strategy explanation |
| Operating margin | Core efficiency after operating costs | Stable across periods | Margin compression that keeps repeating |
| Debt-to-equity | Balance-sheet leverage | Manageable leverage for the industry | Debt rising faster than operating performance |
| Current ratio | Short-term liquidity | Enough cushion to meet near-term obligations | Tight liquidity during slowdowns |
| Interest coverage | Ability to service debt | Earnings comfortably cover interest | Thin coverage that worsens in weak periods |
If the income statement looks strong but the cash statement says something different, trust the cash statement long before you trust the story.
The most useful read comes from combining these ratios, not isolating them. A healthy margin profile carries more weight when cash flow confirms it. A strong growth rate carries more weight when debt is not rising to finance it. That is how you separate a real compounder from a value trap wearing a good headline.
Valuation Benchmarks That Work Better Than a Single Multiple
A single ratio can help, but it cannot carry the whole conclusion. A stock with a low P/E may be cheap, fairly priced, or already impaired. The better process is to compare valuation against history and peers, then ask whether the market is discounting a temporary setback or a lasting decline in the business.
Use multiple lenses, not one screen
FINRA's comparison of P/E and P/S is useful because valuation has to fit the business model. A company with thin or negative earnings may call for a sales-based lens, while a more mature company is often better read through earnings or cash generation, as described in Fidelity's guide to analyzing earnings, revenue, and debt trends. Professional valuation guides also point investors toward EV/EBITDA, free-cash-flow yield, and PEG, along with historical ranges and sector peers. TickerDaily's fundamental analysis guide
That mix matters because the market rarely values every business on the same basis. One company may deserve a premium multiple because it converts revenue into cash with little capital. Another may deserve a discount because its reinvestment needs are heavy or its margins are under pressure. Comparing a stock only to the broad market is too blunt.
Know when a premium multiple is justified
A high valuation multiple is not automatically a warning sign. It can make sense when the business has a long reinvestment runway, strong pricing power, and credible evidence that incremental capital creates value. That is the core reason some investors are willing to pay up for quality compounders, especially when earnings are temporarily muted by growth spending.
The key distinction is between expensive and priced for quality. A stock that looks expensive on trailing earnings may still be reasonable if the business is reinvesting into attractive future economics. If the premium multiple rests on optimism alone, you are paying today for a future that may never show up.
If you want a useful value framework to compare against, see this classic value workflow. It keeps the valuation rules explicit, which makes the judgment easier to repeat.
Ask the question the market is answering
When you evaluate a multiple, do not ask whether it is high or low in the abstract. Ask what the market is assuming about the business. A premium multiple often signals expectations for durable growth, better economics, or a longer runway. A discount often signals fragility, fading demand, or weak capital efficiency. Each stage asks a different question, and skipping the sequence means answering the wrong one.
Qualitative Factors You Still Have to Judge
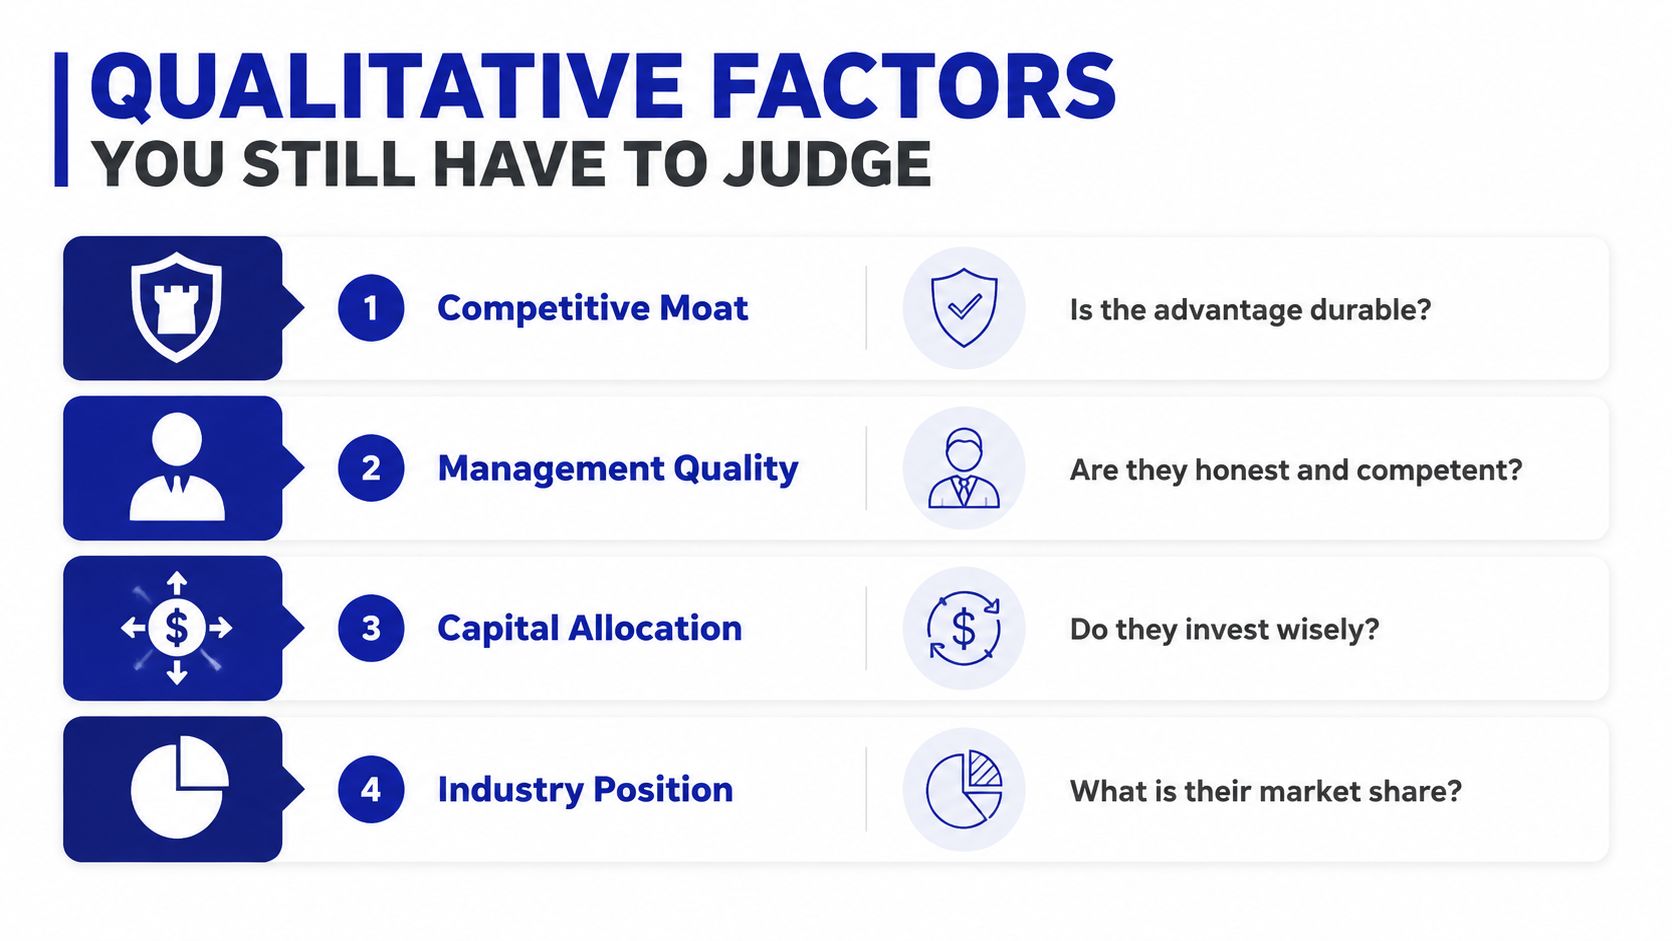
Some of the most important investment questions never fit neatly into a spreadsheet. A company can screen well on margins and valuation and still be a poor fit if its moat is weak or its management keeps making poor capital-allocation decisions. That is why this stage belongs in the process, and why it should be treated as evidence, not as a loose override for a story you already want to believe.
Judge the moat and the management separately
A competitive moat measures durability, whether the advantage is structural and defensible. Look for switching costs, network effects, brand strength, or cost advantages that competitors cannot copy without damaging their own economics. The ultimate test is whether that advantage still appears in the operating results over time, not whether it sounds convincing in a presentation.
Management quality measures behavior. The question is whether leaders deploy capital with discipline, especially when the business has cash to reinvest or return. Do they buy back stock only when it is sensible, reinvest when the economics are attractive, and resist empire building when growth slows? Those patterns usually say more than polished commentary on earnings calls.
Put qualitative judgment on a simple scale
A simple scoring system works better than loose adjectives. Rate moat, management, capital allocation, and industry position as strong, mixed, or weak, then write down the reason for each rating. That process forces a clear record of your judgment and keeps one good conference call from erasing a longer trail of poor decisions.
Qualitative judgment should narrow the decision, not replace the financial evidence.
A stock can have an appealing business profile and still stay on the watchlist if the qualitative case is uncertain. A stock can also look cheap on paper and still fail if leadership has a history of wasting capital or ignoring shareholder interests. The point of this stage is to explain why a strong business may deserve patience, or why a weak one may deserve to be passed over.
Turning the Workflow Into a Scored Rule Set
A workflow only becomes repeatable when it turns into rules you can apply the same way after the market has moved and your memory has faded. That means setting thresholds, weights, and hard stops before you review the stock. Without that discipline, the process drifts into another subjective call shaped by headlines, price action, or the latest earnings reaction.
Write the rules before you look at the stock
Start by assigning weights across the four stages. A value-oriented investor may put more weight on financial quality and valuation, while a quality-growth investor may give more weight to business durability and reinvestment runway. The exact split matters less than choosing it in advance and keeping it fixed.
Then define the verdicts. A stock can fit, be borderline, or violate the strategy. A hard constraint might be weak balance-sheet quality, too much customer concentration, or a valuation that sits far outside the range you accept. A tolerance band keeps minor noise from driving the decision, while a hard stop prevents you from explaining away a clear miss.
A simple structure keeps the score usable:
- Business model, 25%: Clear revenue engine, understandable demand, durable economics.
- Financial quality, 35%: Revenue trend, cash conversion, margins, debt.
- Valuation, 25%: Fair relative to history and peers.
- Qualitative judgment, 15%: Moat, management, capital allocation, industry position.
If a company fails the financial-quality block, the story does not rescue it. If the business is strong but the valuation is stretched, the rule should read borderline unless the premium is justified by the written thesis. The score protects the thesis, it does not replace it.
A written template helps keep those judgments consistent. Monsa's strategy-writing template gives investors a way to store the rules, score each tracked stock against the same framework, and revisit the result with the same criteria instead of improvising under pressure.
The goal is consistency after the market has moved and memory fades.
Pre-Purchase Checklist and Common Traps to Avoid
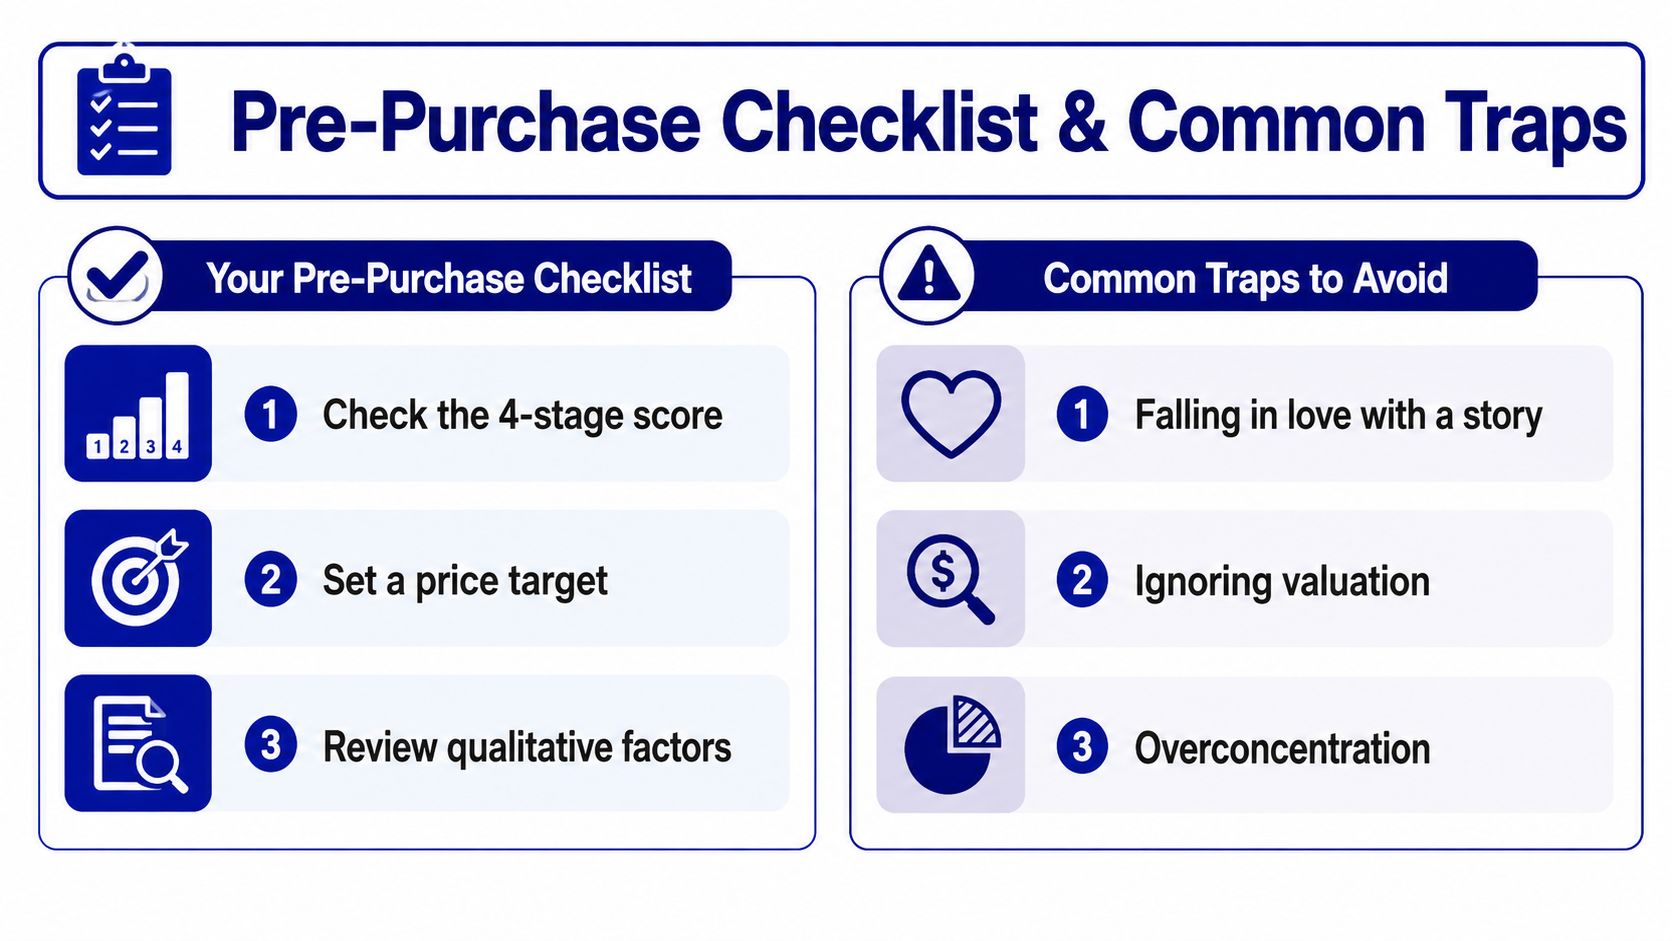
Before you act, use the same checklist every time. Confirm the four-stage score first, then write down the price at which the stock still fits your rules. Finish with one last pass on the qualitative factors so a persuasive story does not get mistaken for a sound decision.
The same three traps appear in almost every bad decision. Falling in love with a story lets narrative overtake evidence. Ignoring valuation can turn a good business into a poor entry point. Overconcentration makes one mistake expensive enough to damage the whole portfolio.
A written trigger keeps the process disciplined. Re-evaluate a holding whenever the facts behind your thesis change, and at least when earnings, debt, or the business model shift enough to change the rules you wrote for it. If a company still has no earnings, use sales, cash burn, capital structure, and the quality of the business model instead of forcing a P/E that does not tell you much. If quality and valuation disagree, give quality the first look, then ask whether the price already assumes most of that quality. A stock can be excellent and still be too expensive.
A practical pre-buy threshold helps here. If your notes say the stock only fits below a certain price and the quote is already above that level, the answer is no, even if the business looks strong. That rule is simple, but it prevents a lot of rationalizing.
The best purchases still fit the rules after a sober review of the business, the financials, the price, and the edge you think will last.
If you want a repeatable way to score stocks against your own rules instead of relying on memory and gut feel, try Monsa and research tools for stock analysis. It stores your strategy, re-scores tracked names nightly, and shows whether each holding still fits the thesis before you add capital or let a position drift too far from its original case.
Monsa is a portfolio-analysis tool, not a broker or investment adviser. Nothing here is investment advice.
// related reading
Strategy Writing Template: A Practical Guide
Use a strategy writing template to turn your investment thesis into checkable rules, thresholds, and nightly fit scores.
7 Strategy Evaluation Examples to Study in 2026
See 7 real-world strategy evaluation examples from Buffett to quant funds. Learn to apply disciplined, rule-based analysis to your own stock portfolio today.
Deep Value Investing Strategy: A 2026 Guide
Master the deep value investing strategy with metrics, screening rules, and risk controls. A practical 2026 guide for serious long-term equity investors.
7 / 100 founding seats claimed - $100/yr locked, then $190/yr
Monsa is a portfolio-analysis tool, not a broker or investment adviser. It never recommends what to buy or sell - it checks what you hold against rules you wrote. Nothing here is investment advice.