// blog
10 Fundamental Analysis Software Tools for 2026
Title: 10 Fundamental Analysis Software Tools for 2026
The most common assumption about fundamental analysis software is wrong because it assumes one terminal can do every job. It can't. A screen for finding candidates, a model for estimating value, a dashboard for reading trends, and a portfolio monitor for checking whether a thesis still holds are different workflows, and they reward different interfaces, data depth, and rules.
That's the useful way to compare the field. Look at screening depth, historical financials, valuation and modeling support, qualitative context, portfolio monitoring, transparency, coverage, implementation friction, and fit for the way you work. The category itself has evolved from manual research to digital terminals over decades, from Datagraphs in 1970 to MarketSmith in 2011, with algorithmic features later added on top, which shows how quickly investor-facing software has moved from static charts to always-on research systems (market growth timeline).
Monsa sits in a different lane from most tools on this list. It doesn't try to be a general charting terminal. It stores the strategy an operator wrote down, turns that thesis into checkable rules, then scores each holding against those rules every night so the question becomes whether the book still fits the written discipline, not whether a stock looks interesting today.
Table of Contents
- 1. Monsa
- What it does better than a traditional screener
- Where it fits and where it stops
- 2. Stock Rover
- How the workflow feels in practice
- Best fit and friction points
- 3. TIKR Terminal
- Why operators use it
- The limitation that changes the workflow
- 4. Koyfin
- What the platform is good at
- Where it trails more specialized tools
- 5. YCharts
- Why the presentation layer matters
- What to watch before adoption
- 6. Simply Wall St
- Where the visual workflow helps
- The limits for research operations
- 7. Morningstar Investor
- How it helps a mixed portfolio process
- Where it's not specialized
- 8. Seeking Alpha Premium
- What makes it different
- Why the distinction matters
- 9. GuruFocus
- Where it earns its place
- What new users should expect
- 10. Validea
- Why the model-first approach works
- The trade-off
- Top 10 Fundamental Analysis Software Comparison
- Build a Research Stack That Matches Your Process
1. Monsa
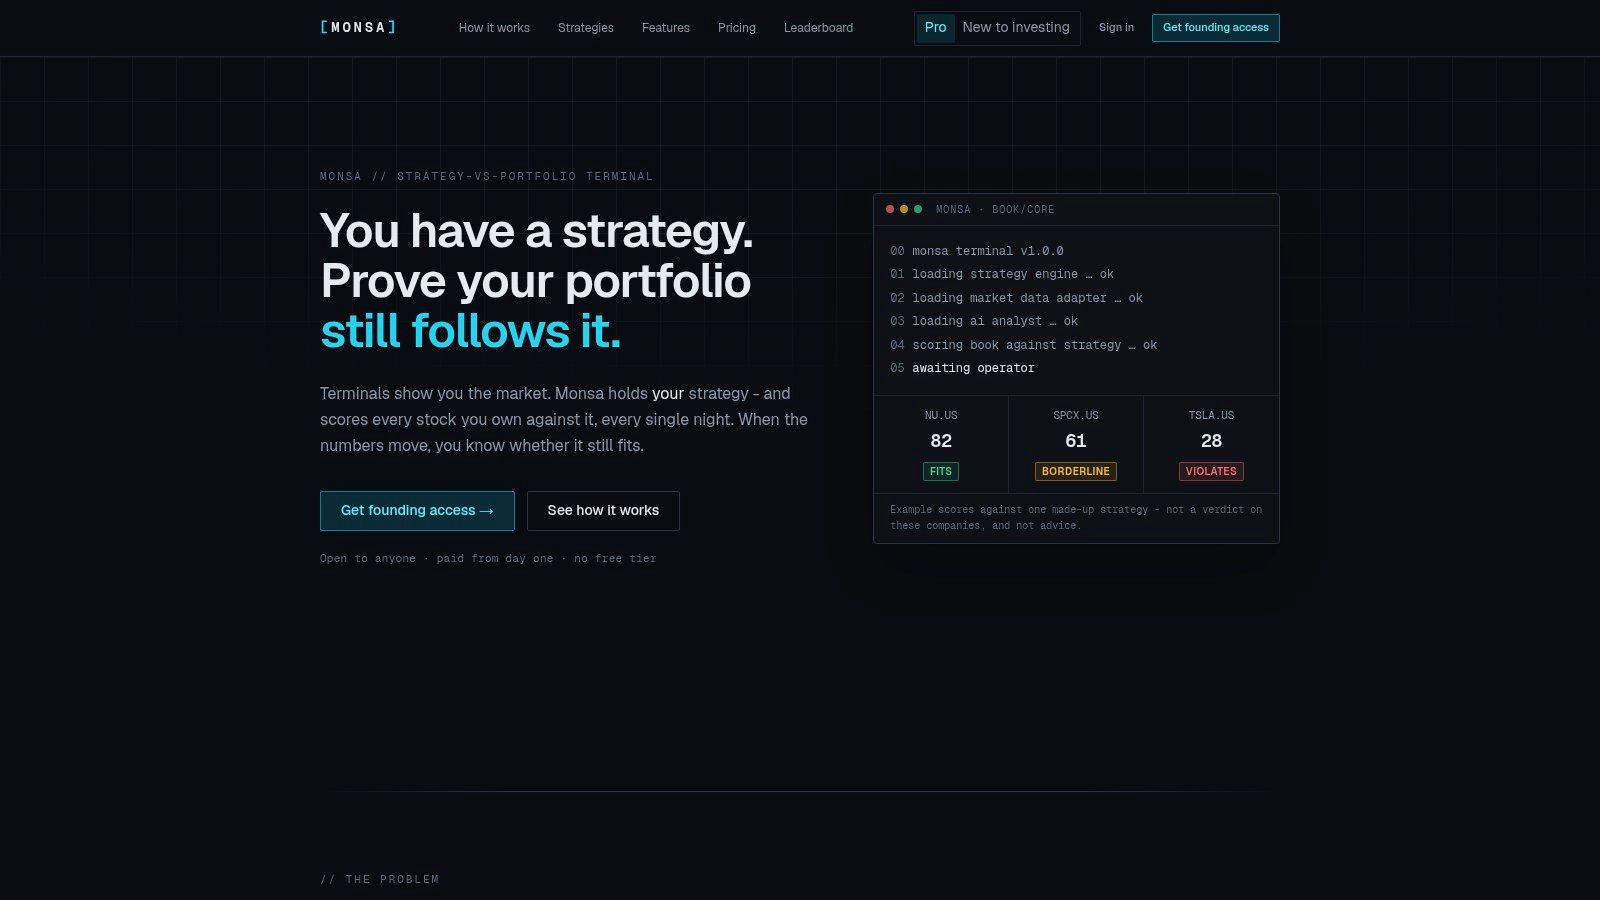
Monsa is the clearest choice on this list for strategy adherence, not raw idea discovery. It is built for operators, independent PMs, small RIAs, and self-directed investors who already know their rules and want a system that checks whether holdings still comply after fresh fundamentals, prices, and FX arrive overnight. The platform's nightly refresh, matrix view, and per-criterion breakdowns make it feel closer to a control panel for a written thesis than a stock research website.
What it does better than a traditional screener
Monsa's core value is that it separates deterministic checks from qualitative judgment. Reported, derived, and missing metrics are flagged explicitly, the score runs on a numeric scale, and the verdict is stated as fits, borderline, or violates rather than buried in a generic ranking. That matters because the platform is designed to show what changed, not to suggest a trade.
The workflow is practical. You can start from a set of published strategy templates, including GARP, Deep Value, Quality Compounders, Dividend Growth, Momentum, and Wide Moat, or you can capture your own thesis in natural language and tune the thresholds. For ongoing oversight, the matrix view shows every ticker against every strategy at a glance, which is a better structure for book-level discipline than a one-name research page.
Practical rule: use Monsa when the real question is not “Is this company interesting?” but “Does this holding still match the rules I already set?”
Where it fits and where it stops
Monsa is also explicit about its limits. It is end-of-day focused, not intraday, and it covers US and major European exchanges rather than claiming universal market depth. It does not place trades, and it is not an advice engine. The arithmetic is deterministic, while Claude handles only the qualitative parts that need judgment.
Monsa's plan structure is easy to evaluate without procurement guesswork, since it's described directly on the website rather than requiring a sales call. For operators who want written rules, transparent reasoning, and nightly re-scoring, that clarity matters most.
2. Stock Rover
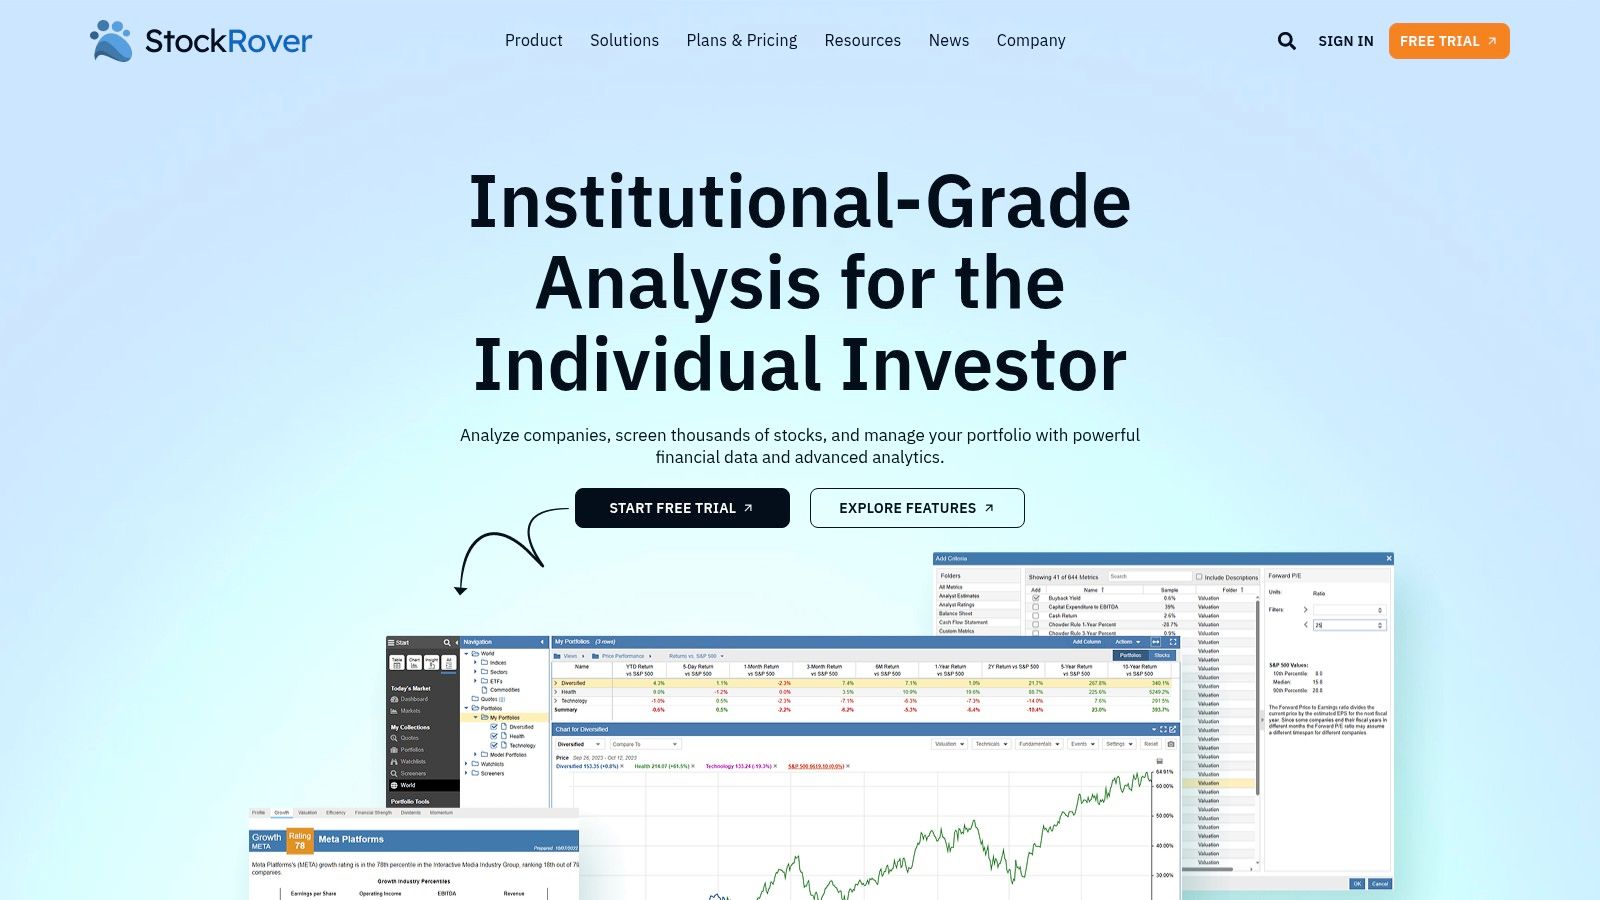
Stock Rover is built for multi-factor screening, especially when the task is to compare companies across several years rather than inspect one ratio. It offers a wide range of metrics, many years of fundamental data on higher tiers, and equation-based filters. That combination supports layered screens for profitability, valuation, growth, and financial strength. Its reports cover a broad universe of stocks, while dividend-history tools support income-focused research (Stock Rover).
How the workflow feels in practice
The central workflow is rank, sort, and narrow. An operator can construct a screen, rank the results, and create a shorter list for company-level review. That makes Stock Rover more useful for idea discovery than for writing or testing an investment thesis.
Brokerage-linked portfolio tracking and alerts extend the platform into monitoring. They can help users watch holdings after the research stage, although this is still different from checking whether each position follows a predefined strategy. For a broader comparison of discovery-first screening and rule-based portfolio review, see this deeper comparison with Monsa.
The interface is dense. Users who work with screens regularly may value the number of available controls, while new users must spend time mapping menus and fields to their process. That learning cost matters for teams seeking a quick visual assessment.
Best fit and friction points
Stock Rover suits investors who want a retail-accessible research system with more structure than a casual stock site. It is less suitable when the priority is polished presentation or a lightweight visual overview. Export functions and real-time quote access can vary by subscription tier, so plan selection should follow the intended workflow.
Practical rule: use Stock Rover to find and rank candidates, then use a separate monitoring process to test whether existing holdings still match their written rules.
3. TIKR Terminal
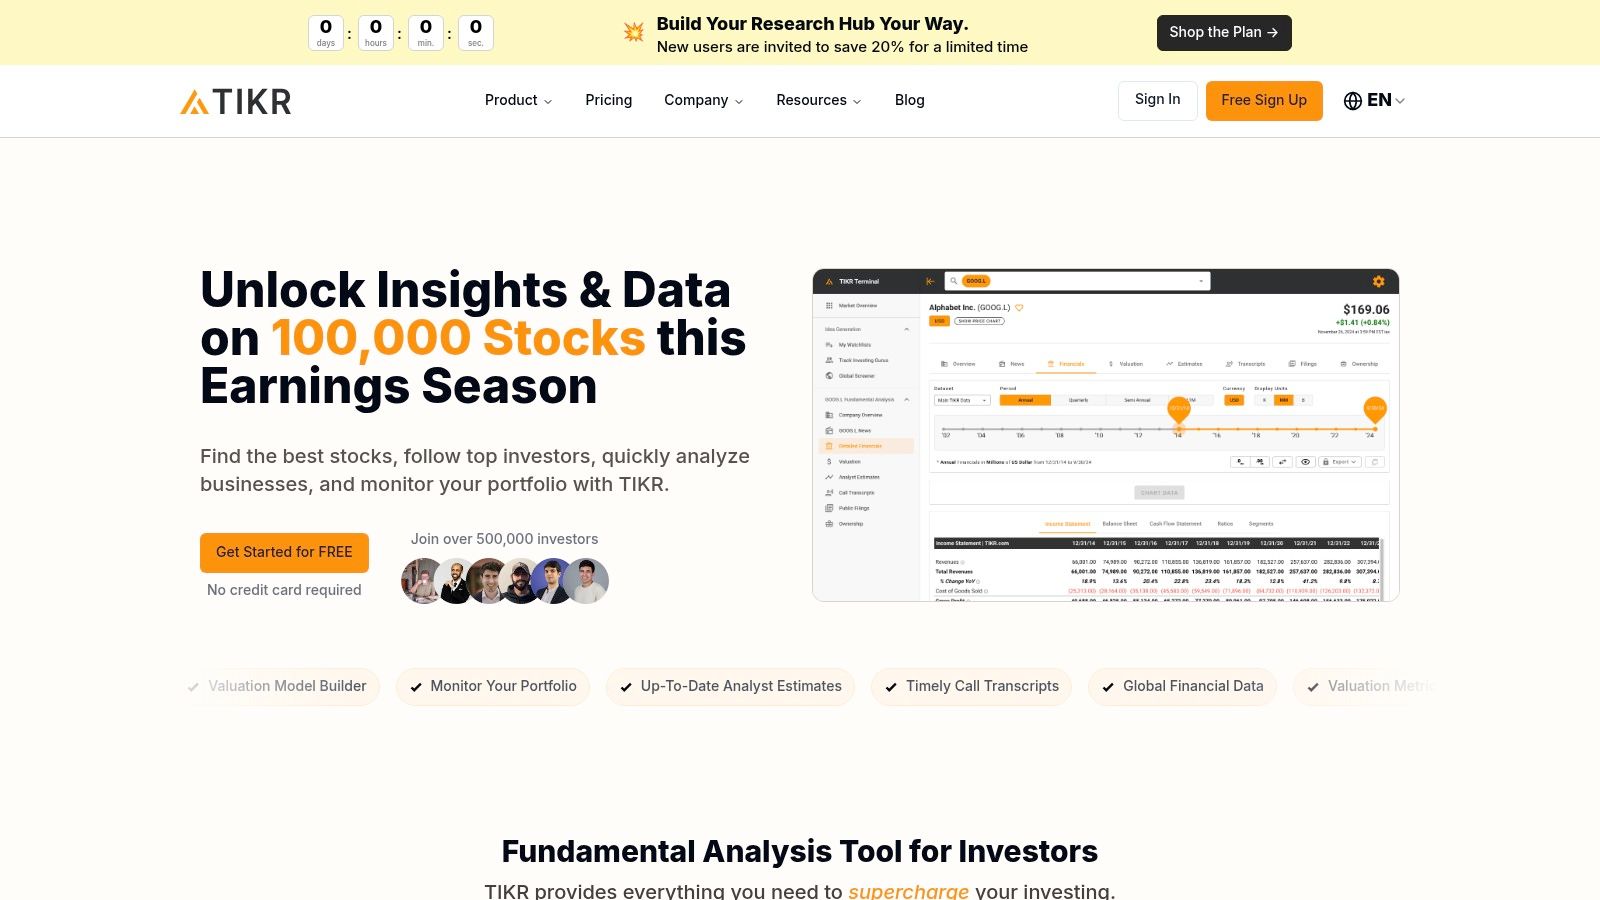
TIKR Terminal is a good fit when the research job starts with global company discovery and continues into historical comparison, transcripts, and model work. Its coverage spans many international markets, and its financial history reaches back many years depending on tier, which makes it useful for cross-company analysis that needs more than a few years of statements. The platform also includes analyst estimates, valuation models, saved screens, and Excel export on higher plans (TIKR).
Why operators use it
The main advantage is continuity between discovery and modeling. A user can identify a company, inspect long financial histories, review estimates and transcripts, then push the work into Excel. That makes TIKR useful for analysts who still prefer spreadsheet control but don't want to assemble every data pull by hand.
TIKR's plan structure is also easier to understand than many enterprise tools. Its tiered ladder makes it possible to know whether a feature is present before a team adopts it, even though some of the deeper history and advanced features sit behind the top plan.
The limitation that changes the workflow
The platform is strongest for research depth, not for broad portfolio rule enforcement. If the job is to compare companies and build a model, it performs well. If the job is to track a written investment process across a book, the workflow becomes less direct. Advanced features such as extended history and catalyst tracking live higher up the stack, so operators should verify whether the specific tier covers the exact research process they expect to repeat.
4. Koyfin
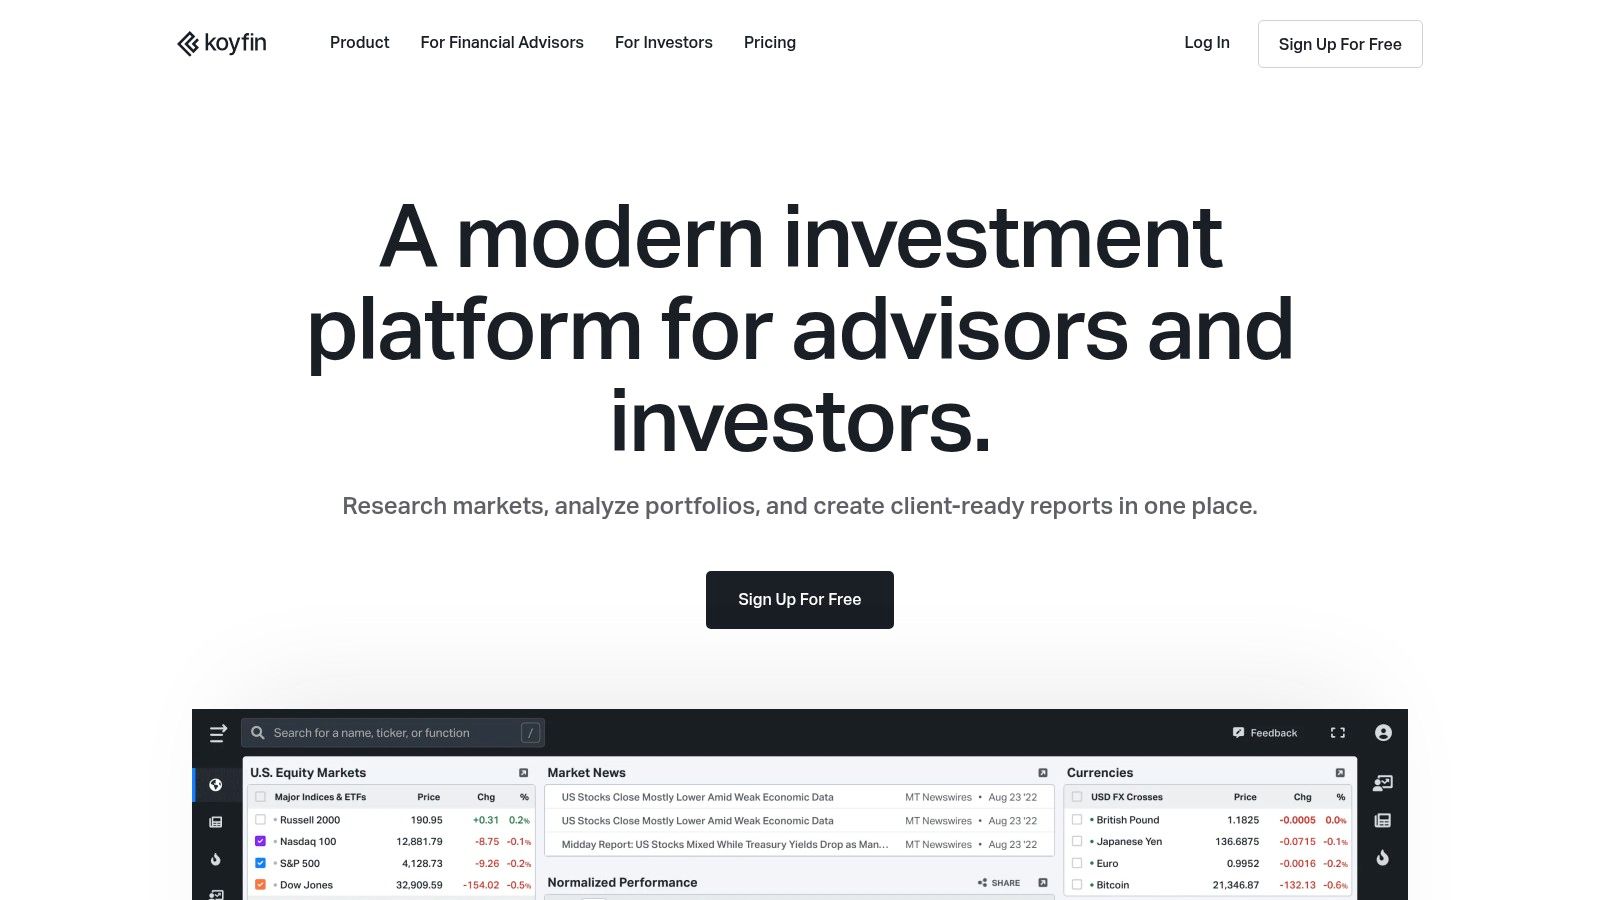
Koyfin is best thought of as a visual research layer. It combines price data, fundamentals, valuations, estimates, macro series, news, transcripts, and alerts in a dashboard-centric interface, which makes it useful for quick peer comparison and trend review. For operators who think in charts and dashboards rather than in static tables, that's a real advantage (Koyfin).
What the platform is good at
Koyfin helps users move quickly across contexts. You can compare peers, inspect business trends visually, and keep related news and transcripts close to the rest of the data. That reduces the friction between “I noticed something” and “I need to verify it across another series or filing.”
The alerting layer is also practical. Instead of treating fundamental research as a one-time event, Koyfin gives you a way to keep tabs on changes that matter. For many analysts, that's the difference between a pretty dashboard and a usable workflow.
Koyfin is strongest when the operator wants context fast, not when they need the deepest screening logic or backtesting machinery.
Where it trails more specialized tools
The platform's screening and backtest depth are lighter than tools built specifically for quant-like workflows. Some advisor features are also reserved for higher-tier plans, so teams that want to standardize on a lower-cost tier should inspect the feature map carefully. Koyfin is valuable as a visual layer, but it does not try to replace a dedicated portfolio discipline system.
This comparison with Monsa is relevant if you want to separate visual context from ongoing thesis checks. Koyfin helps you understand the business. Monsa helps you verify whether the holding still matches the written strategy after the data updates.
5. YCharts
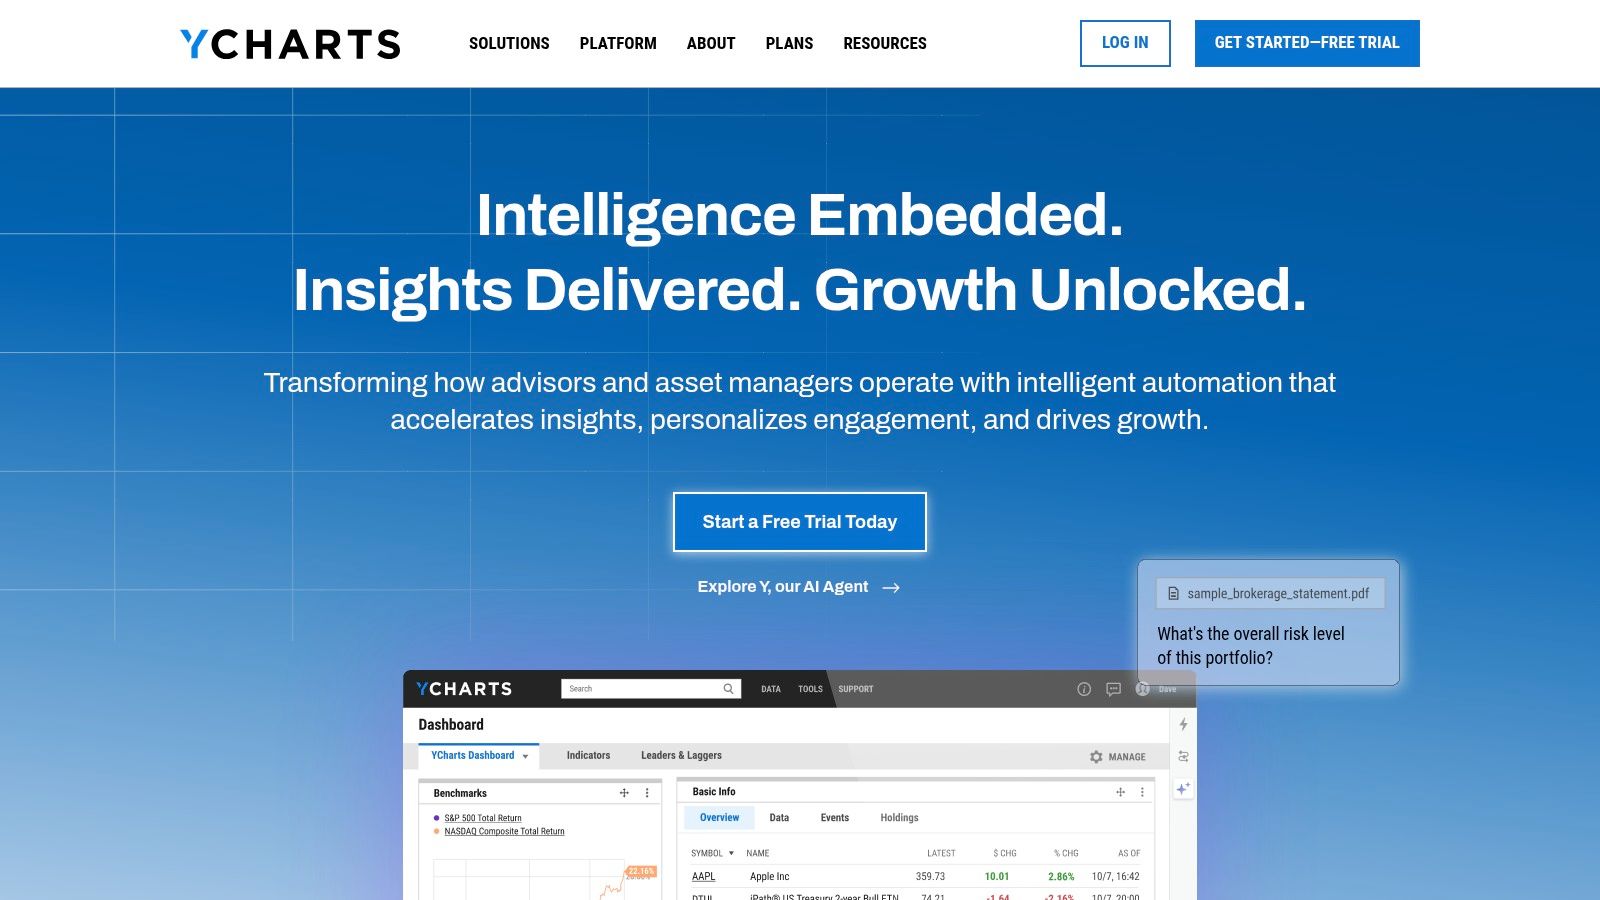
YCharts is built for advisor-style research presentation. It combines fundamental charting, screeners, custom scoring models, model portfolios, and client-facing reporting, so the workflow is not just about discovery, it's about turning research into something readable for a meeting or a report. For firms that need a polished handoff from analysis to presentation, that is a meaningful advantage (YCharts).
Why the presentation layer matters
A lot of research tools stop once the analyst understands the name. YCharts keeps going. The visual output is designed to support a repeatable communication process, which is useful for advisors, asset managers, and anyone who needs to explain a screening result or a portfolio view to another person.
Live onboarding and account support also lower implementation friction. That's not a trivial detail in a team environment, because the fastest tool on paper can still fail if no one uses it consistently.
What to watch before adoption
Pricing is sales-led, so procurement has to ask for a quote. That makes direct comparison harder than with tools that publish web tiers, and per-seat costs can vary. YCharts is therefore less of a casual self-serve purchase and more of a workflow decision for teams that value presentation quality and guided setup.
For operators whose main need is to monitor whether holdings still satisfy written rules, YCharts is not the most direct fit. Its strength is getting from screening to presentation cleanly, not running nightly portfolio discipline against a private rule set.
6. Simply Wall St
For a quick company check, Simply Wall St often does more than a dense terminal. Its visual fair-value views, company summaries, portfolio insights, and themed discovery help an analyst decide whether a name deserves deeper work (Simply Wall St).
Where the visual workflow helps
The platform converts basic fundamental questions into screens that are faster to scan than table-heavy research terminals. An investor can review valuation context, company characteristics, and portfolio exposure before opening a detailed model elsewhere. That makes it useful for early-stage idea research, rather than as the central source for raw-data analysis.
Its free tier lets prospective users test that workflow before paying. For individual investors, this provides a lower-commitment way to assess whether visual summaries fit their research habits.
The limits for research operations
The ceiling appears when the work requires extensive exports, granular data handling, or advanced modeling. The product prioritizes clarity and orientation, so an analyst building a detailed valuation model may need another system for source data and assumptions. Pricing and plan details are shown at checkout, meaning commercial terms can vary by region and currency.
A comparison of Monsa and Simply Wall St clarifies the difference between idea research and portfolio rule monitoring. The platform is suited to understanding a company and deciding whether to investigate it. Monsa addresses a later operational task, checking a written thesis against existing holdings on a recurring basis. That distinction matters: a strong discovery interface does not replace a system for monitoring whether portfolio rules still hold.
7. Morningstar Investor
Morningstar Investor works well for households that combine stock research with fund and ETF selection. Its equity and fund coverage, fair-value framework, moat framework, portfolio X-Ray, alerts, and watchlists make it more than a stock screener, but less like a raw-data terminal than the more specialized tools above (Morningstar).
How it helps a mixed portfolio process
The practical value is breadth. A household that owns individual stocks and also allocates through funds can use one platform to inspect both sides of the portfolio. The fair-value and moat framing also gives the research process a common language that's easier to share across a team or family.
For many investors, that combination matters more than extreme data depth. The platform's independent research brand is part of the appeal, especially when a user wants a straightforward baseline rather than a customizable terminal.
Where it's not specialized
Morningstar Investor isn't designed for deep equity modeling in the way TIKR or more research-heavy tools are. That's not a flaw, it's a scope choice. It's broad enough for many portfolio contexts, but it doesn't try to become the place where every valuation assumption lives.
For an operator focused on whether a specific holding still fits a private rule set, Morningstar is useful context, not the final discipline layer. It can inform the question. It doesn't organize the ongoing rule check around your own written thesis.
8. Seeking Alpha Premium
Seeking Alpha Premium is strongest as a research and idea-sourcing layer. It mixes fundamentals data, quant grades, screeners, transcripts, contributor analysis, and earnings-call context, which gives operators multiple angles on the same name. The platform is especially useful when a researcher wants to compare published opinion with a factor grade and then separate both from their own independent conclusion (Seeking Alpha).
What makes it different
The contributor network is the headline feature. It creates range, which is useful, but range also introduces inconsistency. That means the platform works best when the reader treats contributor pieces as inputs, not verdicts.
The quant grading system is better used as triage than as an answer. It helps sort the field by factor profile, then the operator can decide which names deserve deeper reading. That is a research habit, not a buy-list habit.
Why the distinction matters
The platform can accelerate discovery, especially for U.S. equities, but the analytical quality of the written content varies. A disciplined operator has to separate the article, the grade, and the underlying company data before drawing any conclusion.
Useful habit: read the transcript first, then the grade, then the opinion piece. That order keeps contributor framing from leading the process.
For portfolio oversight, Seeking Alpha is a source of context, not a rules engine. It helps explain what the market is discussing. It does not replace a system that checks whether a holding still follows the strategy an operator wrote down.
9. GuruFocus
GuruFocus is built for value-oriented research and valuation work. Its GF Value and GF Score metrics, All-in-One Screener, valuation calculators, ownership data, and spreadsheet add-ins make it practical for operators who want historical factor screens and valuation worksheets in one place (GuruFocus).
Where it earns its place
The platform is useful for idea curation because it combines screening with valuation thinking. Historical screens help users narrow the field, and calculators like DCF support deeper review once a company makes the first cut. That makes it a good fit for analysts who want a repeatable workflow from screen to valuation.
Insider and guru holdings data are part of the value-investing appeal as well. They don't answer the thesis on their own, but they can add context when an operator is checking how ownership patterns line up with a broader research case.
What new users should expect
GuruFocus has a learning curve. The interface and the breadth of modules can feel heavy at first, especially for investors who just want a quick visual read. Pricing can also vary by region and plan, so the exact cost structure needs verification before a team commits.
For the operator who wants a predefined rules platform, GuruFocus is more flexible and more hands-on, but less explicit about strategy discipline than Monsa. It's a strong valuation toolkit, not a nightly compliance layer for a written thesis.
10. Validea
Validea is the most clearly rules-based platform on this list. Its Guru Analysis report cards tie stocks to strategy rule sets associated with Graham, Buffett, Lynch, and other classic frameworks, which makes it useful for investors who want a quick fit check against a predefined style (Validea).
Why the model-first approach works
Validea is not trying to be a raw-data warehouse. It is trying to map a stock to a model. That makes it efficient for users who already think in style buckets and want to know whether a name fits a given framework before they spend more time on it.
The stock screener, combined model views, model portfolios, and ETF factor screener reinforce that approach. The platform helps users test fit with a known style, which is valuable when the research process is built around rule adherence rather than open-ended exploration.
The trade-off
The same focus is also the limitation. Coverage and tooling lean toward rule models, not broad data exploration or terminal-style exports. If an operator needs to inspect raw fundamentals across a lot of dimensions, another platform will feel more complete.
Validea belongs in the conversation because it asks the same kind of question Monsa asks, even if it answers it differently. The difference is that Monsa checks written operator-specific rules against the live book every night, while Validea maps names to classic strategy templates.
Top 10 Fundamental Analysis Software Comparison
| Product | Core features | UX & quality (★) | Value & Pricing (💰) | Target audience (👥) | Unique selling points (✨ / 🏆) |
|---|---|---|---|---|---|
| Monsa 🏆 | Strategy-vs-portfolio rules; published strategy templates; nightly fit scoring; AI-assisted qualitative analysis; portfolio constraints | ★★★★★ | 💰 Single plan; pricing detailed on website | 👥 Self-directed investors, indie PMs, small RIAs | ✨ Natural-language thesis→rules; transparent templates; dense matrix view; nightly re-score |
| Stock Rover | Broad metric library; multi-factor screening; ranked screens; brokerage links | ★★★★☆ | 💰 Tiered plans; generous trial; exports/quotes tier-limited | 👥 Retail investors & DIY analysts | ✨ Best multi-factor screener; ranked idea lists |
| TIKR Terminal | Global coverage; multi-year financials; transcripts; valuation models | ★★★★☆ | 💰 Free→top-tier plans; some advanced features gated | 👥 Global equity researchers & long-horizon analysts | ✨ Deep historicals & transcripts at retail pricing |
| Koyfin | Dashboards & custom visuals; price+fundamentals+macro; alerts & transcripts | ★★★★☆ | 💰 Cost-effective for breadth; advisor features on higher plans | 👥 Visual analysts, macro-aware investors | ✨ Fast visual workflows; strong alerting & context |
| YCharts | Fundamental charting; custom scoring; model portfolios; client reporting | ★★★★★ | 💰 Sales-led pricing; per-seat quotes (procurement needed) | 👥 Advisors, institutional RIAs | ✨ Best-in-class visuals + onboarding & client reporting |
| Simply Wall St | Visual fair-value reports; portfolio insights; discovery by themes | ★★★☆☆ | 💰 Free tier; Premium plan; localized checkout pricing | 👥 Beginner investors & visual thinkers | ✨ Intuitive fair-value visuals for quick sanity checks |
| Morningstar Investor | Equity & fund research; fair-value/moat frameworks; X-Ray & screeners | ★★★★☆ | 💰 Clear pricing; frequent first-year discounts | 👥 Households combining funds & stocks | ✨ Independent analyst research & transparent frameworks |
| Seeking Alpha Premium | Quant grades; screeners; transcripts; contributor analysis; AI tools | ★★★★☆ | 💰 Subscription with frequent promotions | 👥 Idea-sourcers, quant triage & earnings researchers | ✨ Large contributor network + quant filters & earnings insights |
| GuruFocus | GF Score & GF Value; All-in-One screener; DCF tools; insider/guru data | ★★★★☆ | 💰 Tiered plans; regional pricing variation | 👥 Value investors & screen-backtest users | ✨ Deep valuation toolkit & prebuilt historical screens |
| Validea | Guru model report cards (Graham/Buffett/Lynch); model portfolios; screens | ★★★☆☆ | 💰 Focused pricing; less emphasis on terminal exports | 👥 Investors who follow classic rule-based strategies | ✨ Transparent strategy-mapped report cards and model screens |
Build a Research Stack That Matches Your Process
There isn't a single winner in fundamental analysis software because the job changes from one workflow to the next. If you need visual orientation, Koyfin and Simply Wall St are easier starting points. If you need multi-factor screening, Stock Rover and GuruFocus give you more structure. If you need global terminal-style research, TIKR is stronger. If you need advisor reporting, YCharts is built around that handoff. If you need qualitative context, Seeking Alpha adds contributor coverage and transcript reading. If you need predefined rules, Validea is purpose-built for that. If you need ongoing portfolio fit checks, Monsa is the most direct match because the unit of work is the holding against the written strategy, not the stock against the market narrative.
A good implementation sequence is straightforward. Define the research question first, then verify coverage and data definitions so you know what the tool measures. Build a repeatable screen or rule set, document the thesis in plain language, review the limitations, and schedule periodic checks so the workflow doesn't depend on memory. That last step matters because many fundamental tools are excellent at discovery but weak at ongoing discipline.
The market's growth and adoption patterns explain why this stack approach matters. Financial analysis software is already widely used across finance departments globally, and institutions increasingly rely on multiple tools, cloud delivery, and structured plus unstructured data together (multi-tool institutional usage, cloud-first stock analysis spending). That's a sign that no single interface owns the whole workflow anymore.
Monsa belongs at the portfolio-monitoring end of that stack. It is for operators who need written strategy rules, transparent criterion-level reasoning, nightly end-of-day re-scoring, and book-level oversight across the holdings they already carry. If that's the problem you're trying to solve, visit Monsa and see how it handles strategy-versus-portfolio discipline in practice.
Monsa is a portfolio-analysis tool, not a broker or investment adviser. Nothing here is investment advice.
// related reading
What Is Portfolio Turnover and Why It Matters
What is portfolio turnover? Learn the SEC formula, worked examples, costs, taxes and benchmarks to judge if trading fits your strategy.
Watchlist Management: A Step-by-Step Guide for Traders
Master watchlist management with actionable steps to create, score, and prioritize your stock list. Learn thesis alignment and alerts setup for better
Florida Unemployment Amount: What You Will Actually Receive
Learn how the Florida unemployment amount is calculated, the $275 weekly cap, duration rules, and how partial earnings change your payment in 2026.
7 / 100 founding seats claimed - $100/yr locked, then $190/yr
Monsa is a portfolio-analysis tool, not a broker or investment adviser. It never recommends what to buy or sell - it checks what you hold against rules you wrote. Nothing here is investment advice.