// blog
Stock Screener for Fundamental Analysis: 10 Best in 2026
Why do so many investors buy a stock screener for fundamental analysis and still end up with a list of names that do not fit their thesis a month later? The problem is not the idea of screening, it is that most tools are built to find candidates, not to keep a written investing rule set alive after earnings, balance sheet adjustments, margin changes, or FX moves. A chart-first workflow can tell you what a stock has done, but a fundamental workflow needs deeper history, point-in-time discipline, qualitative context, and a way to re-check holdings over time.
That is why the best tools for serious self-directed investors divide neatly by archetype. Classic value investors need deep valuation and history. GARP and quality investors need growth, margin, and consistency checks. Dividend investors need payout durability and balance-sheet context. Quant and factor investors need repeatable rules, ranking systems, and point-in-time data that can be tested without look-ahead bias.
Table of Contents
- 1. Monsa
- 2. FINVIZ Elite
- 3. Stock Rover
- Where it fits
- 4. GuruFocus All-In-One Screener
- Best use case and limitation
- 5. Seeking Alpha Premium
- Best fit by style
- 6. Simply Wall St
- Where it makes sense
- 7. TradingView Stock Screener
- 8. Koyfin
- 9. Portfolio123
- Best use case
- 10. YCharts
- Best use case
- Top 10 Fundamental Stock Screener Comparison
- Choosing the Right Screener for Your Style
1. Monsa
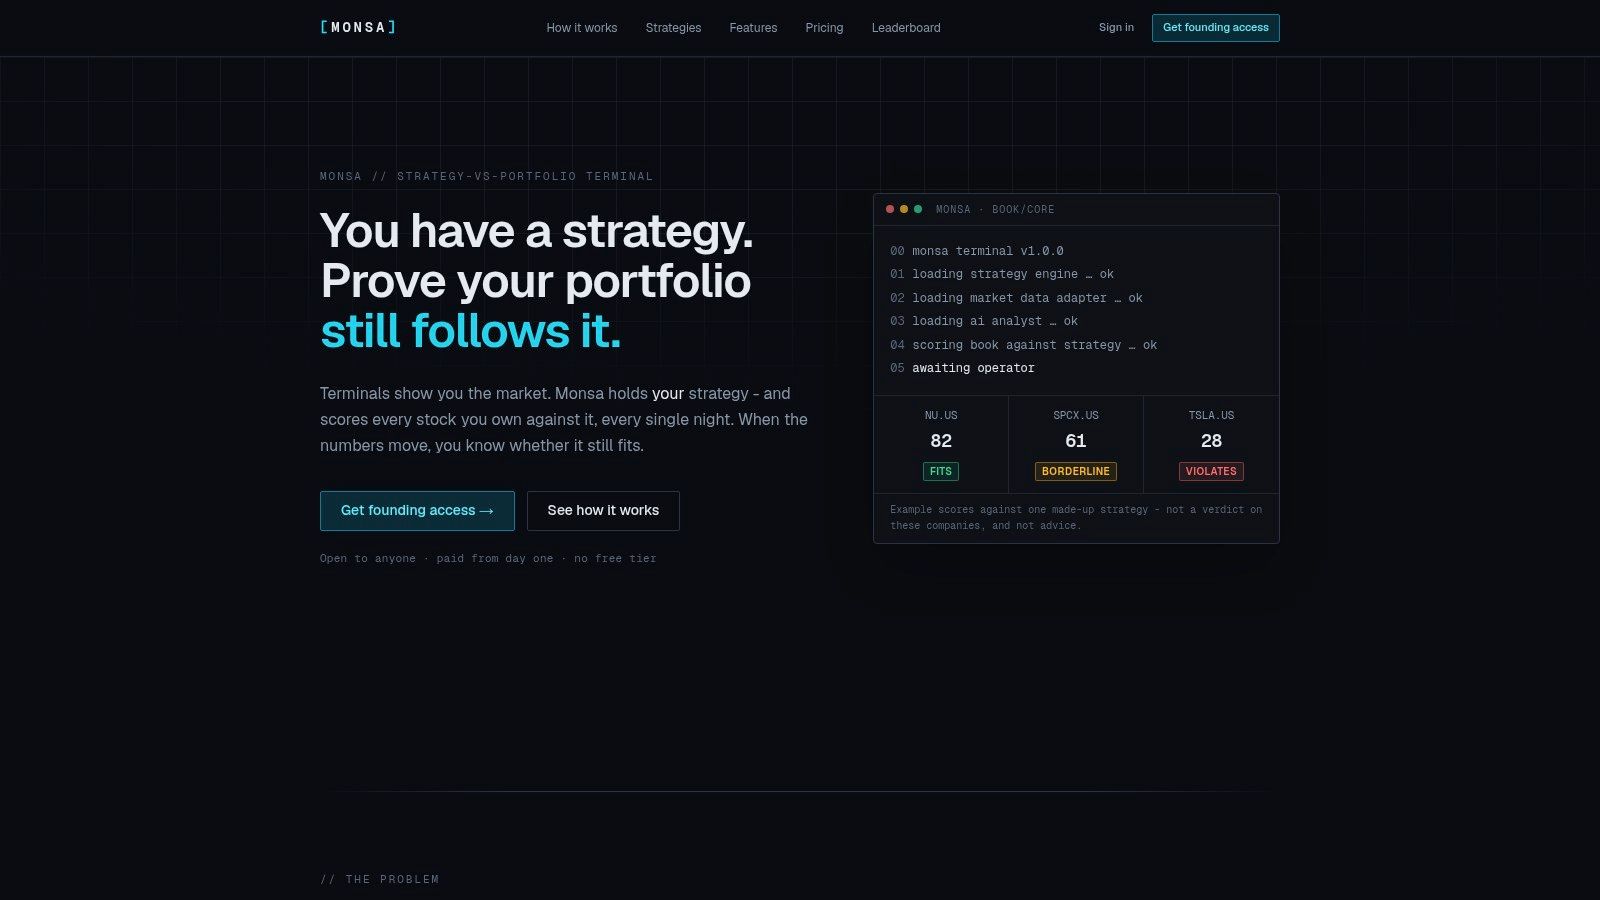
Monsa is built for investors who want screening to follow a written process, not just surface cheap names. It scores a live portfolio against the user's own rules, using a 34-metric vocabulary and AI qualitative analysis powered by Claude to turn a thesis into checkable criteria, then rerun that logic nightly on tracked and watch-only names. For anyone who has seen a thesis drift away from the original setup, that matters more than another layer of charts.
The interface is organized as a dense matrix, so every stock can be checked against every strategy at once, with verdicts such as fits, borderline, and violates. Monsa also includes 10 templates, among them GARP, Classic Value, Deep Value, Quality Compounders, and Dividend Growth, which makes it useful as a ready-to-use workflow blueprint rather than a blank screening canvas. That shifts the tool from discovery alone to ongoing discipline.
Monsa is most useful for investors who run rules they want enforced. It supports portfolio-level constraints, watchlist scoring, price alerts, and IBKR import, while also flagging reported, derived, and missing data so the score does not become a black box. The nightly refresh uses end-of-day fundamentals, prices, and FX for US and major European exchanges, so it fits monitoring workflows that discovery-first screeners often ignore.
- Best fit: Classic value, GARP, and dividend investors who want ongoing thesis checks.
- Strengths: Transparent scoring, natural-language strategy capture, portfolio constraints, and AI-assisted qualitative judgment.
- Limitations: No free tier, IBKR is the only integration today, and it does not offer backtested performance claims.
Pricing is straightforward, and the current rates are listed on the Monsa pricing page. For investors who would rather pay for rule enforcement than for another charting surface, that is a coherent tradeoff.
2. FINVIZ Elite
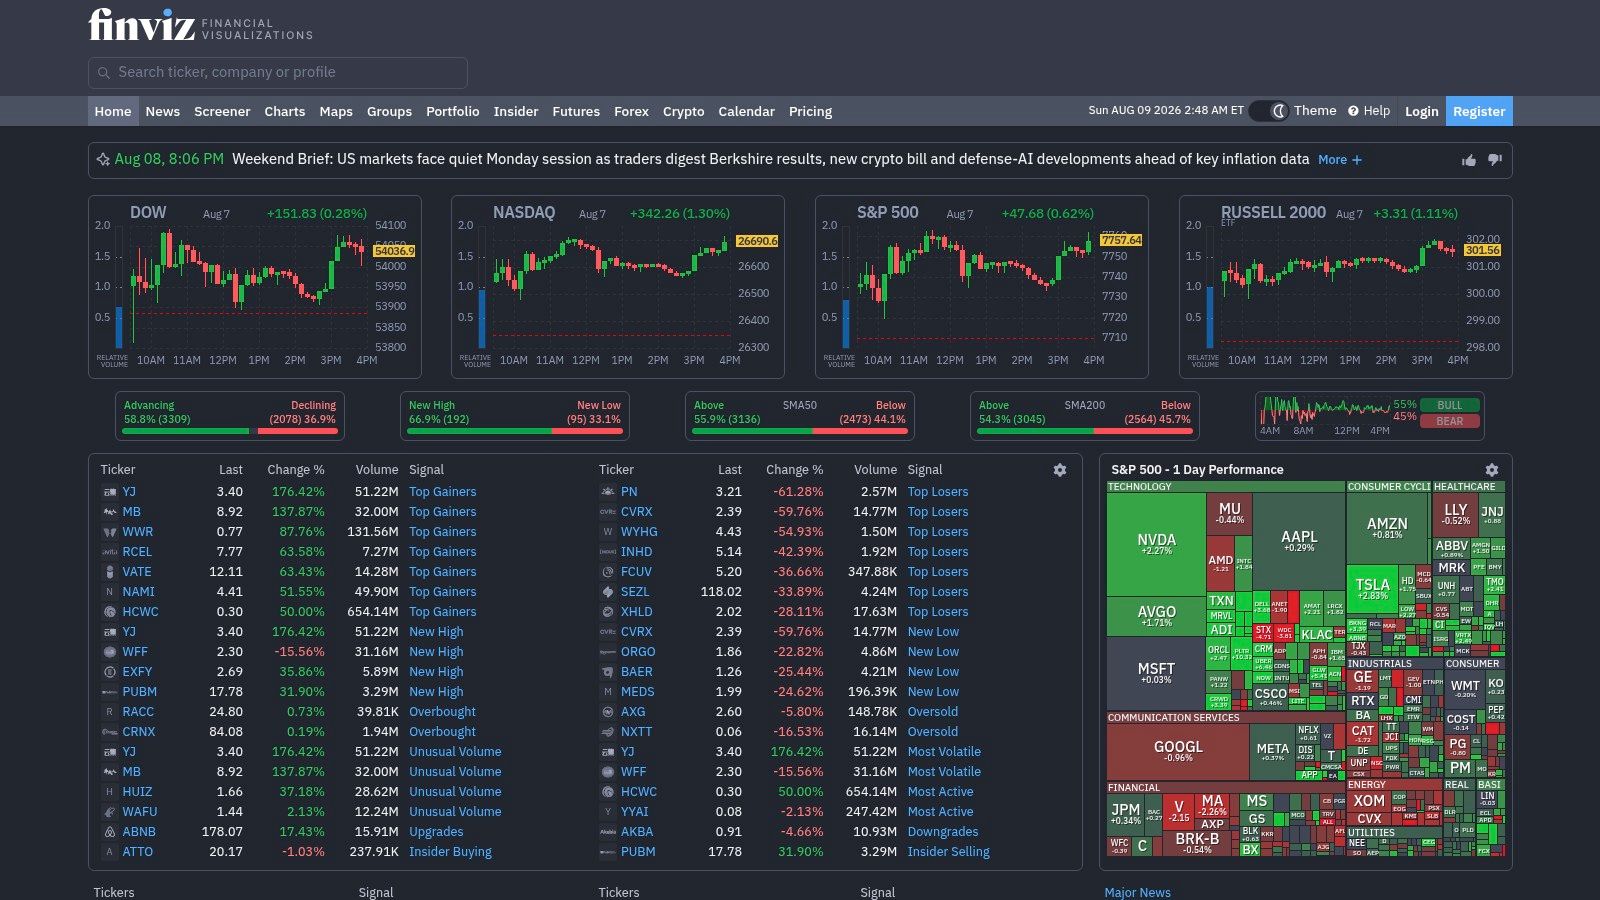
FINVIZ Elite works best as a fast first-pass filter for investors who already have a process and want to move through a broad universe without slowing down. Its strength is speed plus enough fundamental coverage to sort valuation, profitability, growth, ownership, and signals in one screen, so a large list can be cut to a manageable shortlist quickly. For classic value and GARP users, that is useful because the tool helps identify candidates before deeper work starts.
The Elite tier matters because it adds the pieces that make the screener more useful for ongoing review. Real-time quotes, charts, alerts, and export support turn it from a simple idea generator into something closer to a lightweight research workflow. FINVIZ also adds heatmaps, news, insider transactions, and SEC filings, which gives a faster sanity check before you move into a more detailed model or memo. The free version is much thinner, with delayed data and ads, so the difference between tiers is not cosmetic.
A dividend investor can still use it, but mostly as a screening gate rather than a monitoring system. A quality or value investor can combine basic profitability and valuation rules, then hand the shortlist to a deeper tool for history, revisions, or scenario work. That division of labor is where FINVIZ makes the most sense.
For investors who want to compare screener roles before committing to a workflow, the FINVIZ Elite comparison view is useful as a reference point against slower research platforms.

- Best fit: Investors who need a fast, visual first-pass screener.
- Strengths: Speed, intuitive filtering, broad built-in metric coverage, and useful alerts in Elite.
- Limitations: Less flexible than quant-grade tools, and it does not provide deep in-product modeling or DCF workflows.
The core tradeoff is clear. FINVIZ saves time at the top of the funnel, but it is weaker when a process depends on historical context, estimate discipline, or repeatable research notes.
3. Stock Rover
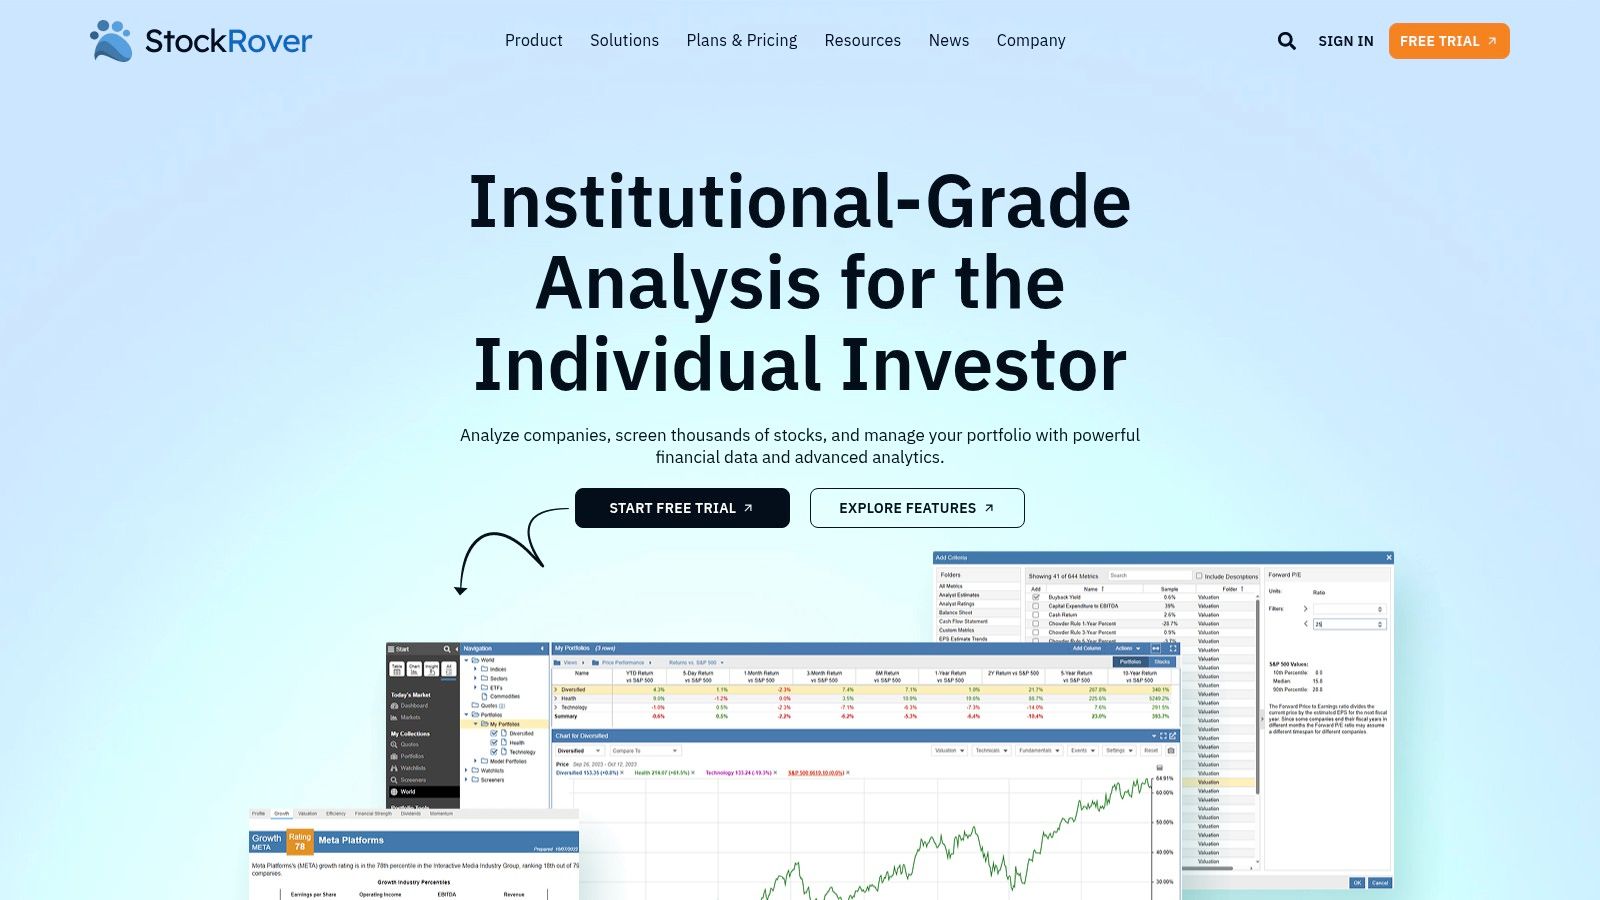
Stock Rover is built for investors who want fundamentals to work like a research workstation, not a simple filtered list. Its value comes from breadth and historical depth, which matters when you compare companies on durability instead of a single quarter's snapshot. For long-term screeners, it is one of the clearest options for ranked and equation-based workflows.
The practical distinction is simple. FINVIZ is faster triage, Stock Rover is deeper analysis with a memory. The platform supports fundamental charting, broker sync, alerts, and historical screening, so you can compare current ratios with prior periods instead of only checking whether a rule passes today.
That makes the Stock Rover comparison view on Monsa useful if you are weighing a monitoring-first terminal against a more traditional research workflow.
For a quality or GARP investor, the fit is straightforward, because both styles depend on consistency across multiple periods. Dividend investors can also use it to keep financial health inside the filter logic, rather than treating yield as a standalone signal. The tradeoff is the learning curve. Once you move beyond preset views, the platform expects you to think in terms of rules, ranks, and workflows.
Where it fits
Stock Rover works best for investors who want a broad research bench more than a portfolio discipline layer. That difference matters. It can help you build and rank a watchlist, but it is less centered on enforcing a strict process after the shortlist is formed.
- Best fit: Long-term, rules-based investors who need deep metrics and historical screening.
- Strengths: Rich metric library, historical depth, ranking support, and broker-linked monitoring.
- Limitations: Advanced features take time to learn, and plan tiers change what is available.
For serious self-directed investors, the main question is whether the screener should only surface candidates or also support the next stage of analysis. Stock Rover does the first part well, and it does it in a way that fits investors who want to compare value, quality, and trend persistence inside one environment.
4. GuruFocus All-In-One Screener
GuruFocus is built for investors who start with valuation and then test that first impression against a wider set of fundamental signals. Its screeners are organized around Buffett, Graham, and Lynch style frameworks, and the platform adds proprietary GF Score and GF Value rankings for faster triage. For a classic value investor, that combination is more than cosmetic. It helps separate stocks that are merely cheap from stocks that still have support in the underlying business.
The useful part is the layering. GuruFocus tracks insider and institutional activity, long-horizon fundamentals, and valuation tools in the same environment, so a screening result can be checked against ownership behavior and balance-sheet quality before you move on. That matters because low multiples alone rarely settle the question. A screen that ignores capital allocation or financial resilience can surface names that look attractive on one metric and fragile on the rest.
Best use case and limitation
A classic value investor gets the clearest fit here, but the platform is also workable for dividend investors who want to verify whether a payout sits inside a healthier business profile. The more interesting use case is not the dividend screen itself. It is the ability to filter for value and then pressure-test the result with historical context, ownership data, and proprietary rankings before the idea reaches a buy list.
For a ready-to-use starting point, a classic value preset can begin with low GF Value relative to price, a solid GF Score, and then a follow-up check on insider activity and balance-sheet strength. That workflow keeps the screen focused on candidates that are cheap for a reason you can examine, rather than cheap because the screen was too blunt.
- Best fit: Classic value workflows and long-horizon fundamental review.
- Strengths: Preset guru templates, proprietary rankings, insider and institutional tracking, and export tooling.
- Limitations: Annual pricing can be higher than some retail peers, and add-ons can raise the effective cost for global users.
GuruFocus is useful when the screen has to do more than sort names by valuation. It helps you narrow a large universe with a value-first filter, then check whether the fundamentals, ownership signals, and quality metrics support further work.
5. Seeking Alpha Premium
Seeking Alpha combines screening with a wider research layer, and that separation of functions is what makes it useful. The screener covers valuation, growth, profitability, momentum, and dividend filters. Quant Ratings and Factor Grades add another layer for idea discovery, so you can test whether a name looks attractive on the screen and whether the platform's own scoring system agrees. For self-directed investors who already know the basics, that creates a practical workflow for comparing candidates before they enter a watchlist.
The tradeoff is in the surrounding research mix. Screening output sits next to platform ratings and contributor commentary, and those inputs do not carry the same weight. A serious investor should treat the screen as a discovery tool first, then use the ratings and articles to refine the list rather than to justify a decision on their own. That distinction matters because the platform can surface useful ideas quickly, but conviction still has to come from your own review.
A useful way to frame the tool is by investor archetype. GARP investors can use it to find companies with acceptable growth and valuation characteristics in the same pass. Quant-leaning investors can start with factor filters, then compare the result with Quant Ratings and Factor Grades to see whether the screen and the model point in the same direction. The broader coverage also helps if your universe is wider than the usual US large-cap shortlist.
The Seeking Alpha Premium screener and review workflow is worth checking if you want to compare its screening layer with a more visual alternative before committing to a process.
Best fit by style
A GARP preset can start with moderate valuation, positive growth, and profitable operations, then use the platform's ratings to trim weak names from the list. A quant-leaning preset can do the same thing with factor emphasis, then push each result through contributor research only after the screen has done the first round of filtering. That sequence keeps the workflow disciplined. It also reduces the risk of treating commentary as a substitute for a rule-based screen.
- Best fit: Investors who want data filters plus ratings and contributor research.
- Strengths: Fast discovery, broad coverage, and a useful combination of screening and editorial context.
- Limitations: Research quality varies, and renewal pricing deserves attention.
The disciplined way to use it is straightforward. Let the screen identify candidates, let the ratings narrow attention, and then verify the thesis in a source that is less opinion-driven before taking action.
6. Simply Wall St
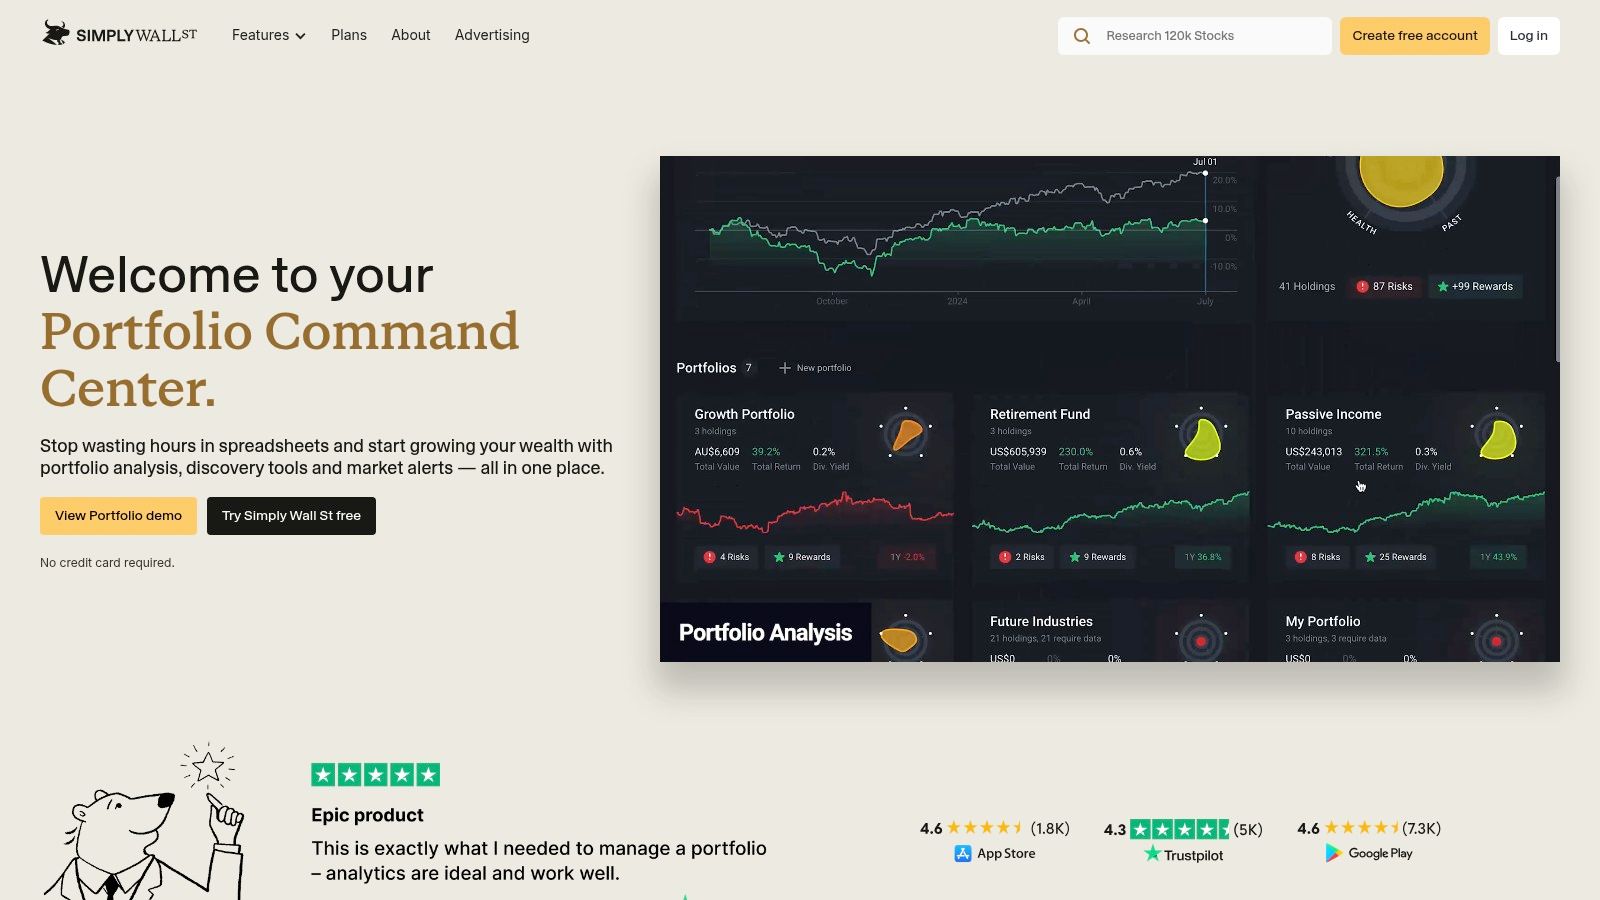
Wall St is built for investors who want fundamentals presented clearly rather than densely. Its visual Snowflake summaries and fair-value framing make it easy to assess valuation, quality, and risk without getting buried in tables. That matters most when you are comparing names across regions and need a fast triage step before committing to deeper work.
The platform also combines portfolio analytics, broker linking, alerts, and narrative explanations. That mix suits investors who want a quick thesis check and a monitoring layer, not a factor-engineering lab. A classic value investor can use the fair-value framing to screen for apparent discounts, while a quality-first investor can use the visual profile to separate balance-sheet strength from weaker businesses. The limitation shows up as soon as the process needs tighter rule control. More custom, technical screening logic will feel constrained here.
For a direct comparison with a more rule-driven workflow, the Monsa's Simply Wall St matchup helps separate visual presentation from screening depth.
Where it makes sense
Wall St fits investors who want to scan quality and valuation quickly, especially across multiple markets. It also suits users who prefer reminders and updates on watchlists and holdings, since the platform works as an ongoing review layer rather than a one-time screener.
A useful way to approach it is to treat it as a front-end for idea triage. Start with a GARP-style preset that looks for reasonable valuation, positive growth, and profitable operations, then use the visual summary to decide which names deserve manual follow-up. A dividend-oriented investor can invert that same process by screening for stable quality and balance-sheet discipline before checking whether the payout profile fits the thesis. The platform is strongest when the question is, “Does this business deserve more attention?” It is weaker when the question is, “Can I enforce my own factor rules exactly?”
- Best fit: Investors who value visual summaries and quick thesis checks.
- Strengths: Approachable presentation, fair-value framing, multi-market scanning, and portfolio reminders.
- Limitations: Lower-tier quotas and less flexibility than quant platforms.
If you already know how to read fundamentals and want the picture compressed into a clean workflow, it is a strong option. If you need custom formulas and strict rule logic, it behaves more like a presentation layer than a full research engine.
7. TradingView Stock Screener
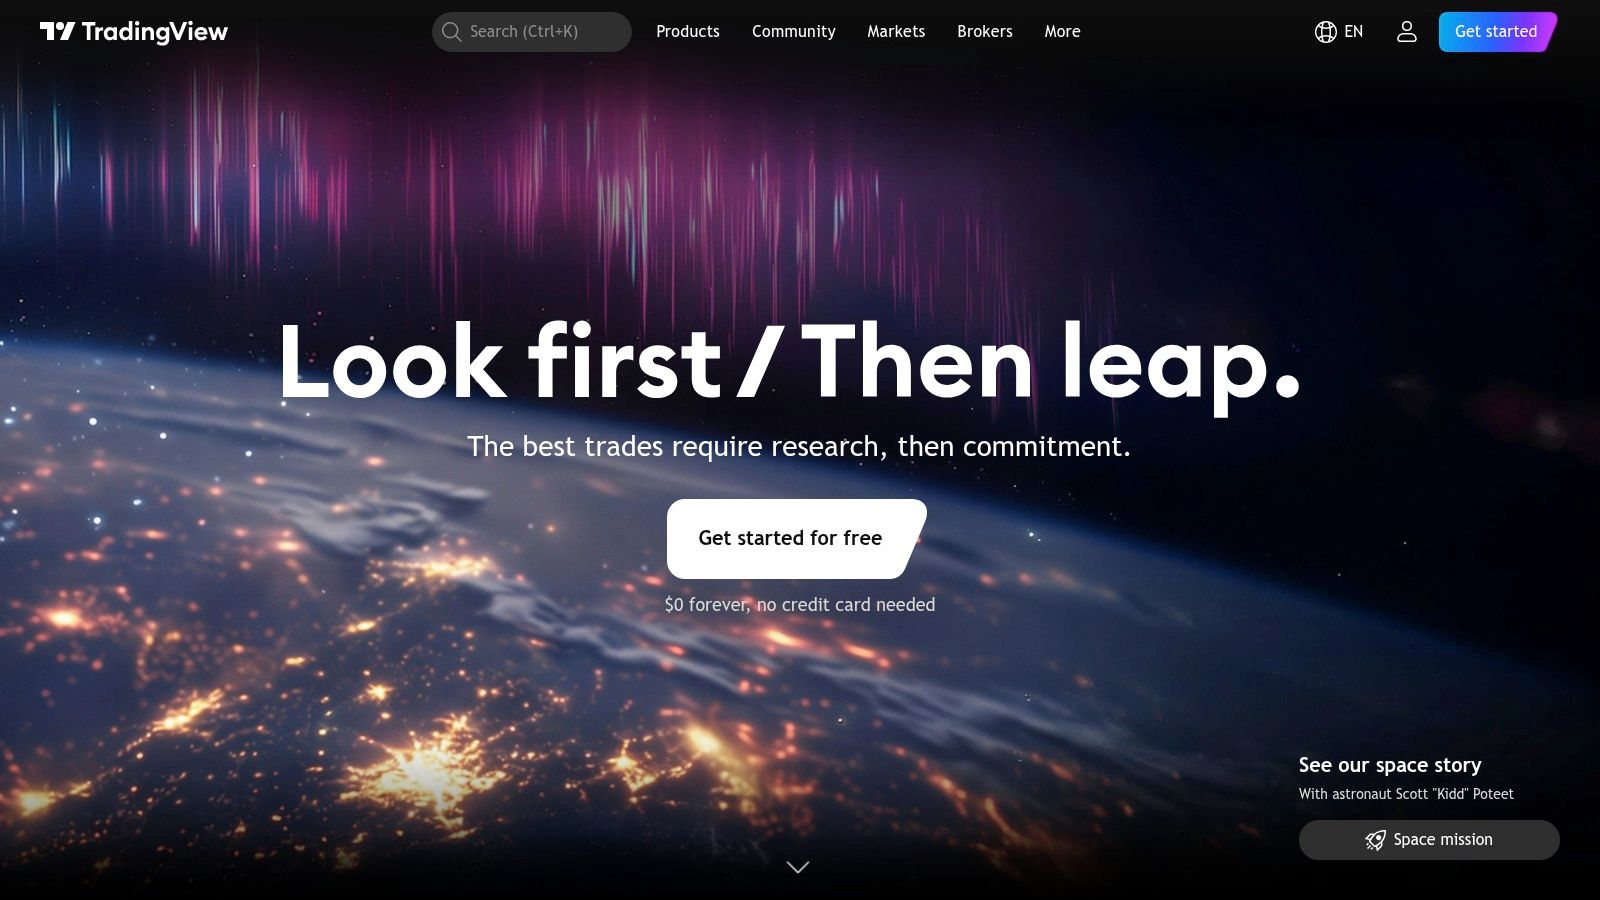
TradingView works best for investors who want screening, chart review, and alert setup in the same workflow. Its screener covers fundamental fields such as valuation, profitability, and per-share metrics, but the advantage is that those filters sit inside a charting platform with alerts, community templates, and Pine-based customization. For a process that treats timing and fundamentals as linked inputs, that combination is hard to ignore.
The trade-off is depth. TradingView is broad and polished, but it does not go as far into accounting detail as dedicated fundamental suites. That means it fits a hybrid process, where screening helps narrow the list and chart work helps decide whether the setup still matters.
A useful way to classify it is by investor style. GARP investors can use it to locate reasonably priced growers, then move straight to the chart to judge whether the market is still confirming the thesis. Momentum-aware fundamental investors can do the same in reverse, starting with price behavior and then checking whether the underlying metrics still support the move. The platform is strongest when screening is one input among several, and weaker when the goal is to enforce strict factor rules across a large universe.
For those who prefer a workflow over a feature checklist, the key question is whether the screener can support decision speed without forcing a separate tool for every step. TradingView does that well. It lets you identify a candidate, inspect the price structure, and set alerts without leaving the workspace. The community layer also matters, because template reuse can save time if you prefer starting from a proven filter set instead of building every screen from scratch.
If you need a practical starting point, a GARP preset here would combine reasonable valuation, positive earnings growth, and decent profitability, then send the result to charts for follow-up. A momentum-aware preset would reverse the order, focusing first on trend and relative strength, then checking whether the fundamentals still justify staying involved. That makes TradingView more than a generic screener, since it acts as a bridge between idea generation and trade monitoring.
- Best fit: Investors who mix fundamentals with charting and timing.
- Strengths: Fast interface, large community ecosystem, and screening tied directly to charts and alerts.
- Limitations: Fewer deep accounting fields than dedicated fundamental tools.
TradingView is strongest when screening is only part of the decision process. If your thesis is fundamental but you still want a clean timing layer, it fits well. If your process depends on strict fundamental re-checks, it usually serves as one component in the stack rather than the whole research system.
8. Koyfin
Koyfin sits closest to a broad research terminal without the enterprise pricing posture. Its screener covers fundamentals, estimates, ownership data, and long financial histories, and the interface is designed for comparison work across names and sectors. That makes it a useful fit when your process depends on cross-sectional analysis rather than isolated stock picking.
The depth matters because it changes what a screen can do. Koyfin's own screener overview says the platform offers 500+ metrics and more than 10 years of historical financials and estimates in its screening stack. For fundamental investors, that combination separates a one-off filter from a repeatable research workflow, since you can compare current conditions against prior periods instead of treating every result as if it were static. The same overview also emphasizes global coverage, accessibility, and flexibility as part of the product's screening pitch.
A practical way to think about Koyfin is through investor style. A GARP user can build screens around valuation, growth, and profitability, then test whether the candidates still make sense in a broader market context. A quant-factor investor can use the same environment for custom formulas, portfolio context, and relative comparison, which makes the tool more useful than a simple yes-or-no screener. The result is less about raw screening volume and more about keeping the research trail intact from filter to shortlist.
The Monsa comparison page for Koyfin is helpful if you are deciding whether you need a general research terminal or a portfolio rule engine that watches for drift. That distinction matters because the two tools solve different problems even when they overlap on fundamentals.
Koyfin also scales cleanly from independent investors to advisors, which matters if your workflow spans multiple accounts or client books. It is a stronger option when you need broad global coverage and rich comparison tools than when you need heavy backtesting or strategy simulation built into the core product.
- Best fit: Investors who want broad global coverage and deep comparison tools.
- Strengths: Strong UI, portfolio context, custom formulas, and long history.
- Limitations: It does not replace heavyweight backtesting in quant-specific platforms.
For self-directed investors who want a tool that feels close to a professional terminal but remains more approachable than legacy institutional software, Koyfin belongs near the top of the shortlist.
9. Portfolio123
Portfolio123 is the clearest quant-grade tool in this group, and that distinction changes how it should be used. It gives investors an equation language, custom factors, point-in-time fundamentals, ranking systems, strategy simulation, and backtesting, so a screen can be turned into a testable process instead of a loose filter set. For rule-based investors, that is a structural advantage because it lets them evaluate a thesis before committing capital.
A useful way to think about the platform is by investor archetype. A quant-factor investor can build and compare rules, a disciplined GARP investor can formalize quality and growth criteria, and a classic value investor can test whether valuation rules still hold up across market regimes. The same toolkit serves all three, but the value comes from different workflows, not from a generic feature list.
The key advantage is not just that Portfolio123 screens stocks. It lets you inspect whether the screen itself has merit. You can convert fundamental criteria into a repeatable framework, check for look-ahead bias, and evaluate whether a rule set survives before you allocate capital. That matters for investors who have already moved past screening as discovery and now want screening as strategy validation.
Rule of thumb: If you want to know whether a screen is worth following, test it first. If you want to know whether a portfolio still fits the screen after earnings, monitor it continuously.
Best use case
For quant/factor investors, Portfolio123 is hard to ignore because the platform is built around rules, ranking, and verification. A classic value investor can also use it well if the goal is to formalize a buy discipline rather than rely on a subjective checklist, and a GARP investor can use the same tools to keep growth and quality rules from drifting into narrative-driven decisions.
- Best fit: Investors who want to turn fundamentals into repeatable, testable strategies.
- Strengths: Point-in-time data, backtests, ranking systems, and automation.
- Limitations: Steeper learning curve and a more complex pricing structure.
If your edge comes from rules rather than gut feel, Portfolio123 gives you the machinery to express that edge. The tradeoff is complexity, but for investors who care about validation, that is often part of the job.
10. YCharts
YCharts is built for advisors and portfolio managers, and that design choice shows up in the way the screener works. It combines flexible filters and scoring models with visuals, dashboards, and spreadsheet integrations, so the output is easier to use in client-facing reports and internal reviews. That matters when the person reading the screen is not the same person building it.
The practical question is not whether YCharts can screen stocks. It can. The harder question is whether you need a tool that turns screening results into presentation-ready material without extra manual work. For teams that must explain holdings, factor exposure, or ranking changes to other people, that workflow is a real advantage. For a personal investor who only wants a few filters and a clean list, the platform can feel heavier than necessary.
Best use case
YCharts fits advisor-style GARP and quality workflows because it combines screening with communication. That pairing matters when you want to rank companies by multiple fundamental traits, then show the result in a format that can be shared without much cleanup. The scoring models help compress a larger set of inputs into something easier to read, while still leaving room to interpret why a name rose or fell in the list.
That makes it more useful for investors who work from a repeatable process and need the output to hold up in front of clients or colleagues. A classic value investor can still use it, but the platform's biggest advantage comes when presentation is part of the job, not an afterthought.
- Best fit: Advisors, portfolio managers, and investors who need client-ready outputs.
- Strengths: Scoring models, strong visuals, and integrations for advisory workflows.
- Limitations: Higher cost and more complexity than casual screeners need.
If your screen has to survive a meeting, YCharts earns attention. If you only need one portfolio monitor and a small set of custom filters, it may be more tool than the job requires.
Top 10 Fundamental Stock Screener Comparison
| Product | Core features | UX (★) | Value (💰) | Target (👥) | Unique selling point (✨) |
|---|---|---|---|---|---|
| 🏆 Monsa | Strategy rule engine; 10 templates; NL thesis→rules; nightly re-scoring; matrix view; AI qualitative (100/mo) | ★★★★☆ | 💰 $19/mo; founding $100/yr (first 100) | 👥 Self-directed investors, small RIAs, clubs | ✨ Enforces written thesis nightly; transparent tunable rules; deterministic + AI blend |
| FINVIZ Elite | Fast screener; advanced fundamental filters; real-time quotes & charts; alerts | ★★★★☆ | 💰 Paid Elite tier (mid) | 👥 Retail screeners, idea triage | ✨ Extremely fast filtering, heatmaps and export |
| Stock Rover | 300-800+ metrics; multi-year fundamentals; ranked & historical screening; broker sync | ★★★★☆ | 💰 Tiered plans (mid-to-high) | 👥 Long-term/rules-based investors, advisors | ✨ Deep historical data and scoring/ranking engines |
| GuruFocus (All-In-One) | Value-oriented screener; GF Score/GF Value; insider/guru tracking; DCF tools | ★★★★☆ | 💰 Annual plans (higher) | 👥 Value investors, deep fundamental researchers | ✨ Proprietary guru/value scores and valuation tools |
| Seeking Alpha Premium | Screener + Quant Ratings; author research; transcripts; alerts | ★★★☆☆ | 💰 Subscription (mid) | 👥 Idea discovery, sentiment + data users | ✨ Blend of quant ratings with contributor research |
| Simply Wall St | Global data; fair-value estimates; 'Snowflake' visuals; portfolio analytics | ★★★★☆ | 💰 Freemium → paid tiers (low-mid) | 👥 Novice investors, high-level scanners | ✨ Very approachable visuals for quick thesis checks |
| TradingView (Screener) | Integrated charting + screener; Pine scripting; multi-asset alerts & community scripts | ★★★★☆ | 💰 Freemium → Pro tiers (mid) | 👥 Traders mixing technicals & fundamentals | ✨ Best-in-class charts + customizable scripts |
| Koyfin | Global fundamentals screener; 10-yr financials; custom dashboards; advisor plans | ★★★★☆ | 💰 Tiered (affordable → premium) | 👥 Independent investors, advisors | ✨ Bloomberg-lite terminal feel with global coverage |
| Portfolio123 | Equation language; point-in-time data; backtests; ranking & strategy simulation | ★★★☆☆ | 💰 Tiered, resource-based (mid-high) | 👥 Quant/systematic researchers | ✨ Backtesting with point-in-time data for strategy validation |
| YCharts | Scoring Models; deep fundamentals; visuals, dashboards; Excel/Sheets add-ins | ★★★★☆ | 💰 Sales-quoted / enterprise (higher) | 👥 Advisors, portfolio managers | ✨ Client-ready reports and scoring models for advisory workflows |
Choosing the Right Screener for Your Style
The right choice depends less on feature count and more on whether the tool matches your investing job to be done. Classic value investors should look first at GuruFocus or Stock Rover, because both support deeper valuation and historical context. GARP and quality investors usually get the most from Monsa, Koyfin, or YCharts, depending on whether they care more about rule enforcement, dashboarding, or client-ready presentation. Dividend investors should prioritize tools that make ongoing monitoring easy, which is where Monsa and Stock Rover stand out because they are better suited to repeated re-checks than a one-time search. Quant and factor investors need point-in-time logic and testability, which makes Portfolio123 the clearest fit.
A practical stack is often better than a perfect single platform. Many serious investors can pair one free or low-cost broad screener, like TradingView or FINVIZ, with one paid deep-fundamentals product, then use a second layer for monitoring. That combination keeps discovery broad while preserving enough depth to avoid shallow decisions.
The biggest mistake is buying the most feature-rich tool and assuming that will create discipline. It usually does not. The best screener is the one you will use weekly, because steady use is what keeps criteria consistent, catches drift early, and makes your process repeatable.
For investors who already have a written thesis, the next step is not more browsing. It is enforcement. A rule-driven tool like Monsa is valuable because it re-scores holdings nightly, which helps surface one of the most common failure modes in fundamental investing, thesis drift after earnings, balance sheet changes, margin compression, or FX moves. If your process depends on holdings still matching the plan, choose the screener that checks the plan for you.
If you want a screener that treats your thesis like a live operating system, not a one-time filter, visit Monsa. It is built to score holdings against explicit rules, refresh those scores nightly, and show you which names still fit. That is the kind of discipline this category is supposed to deliver.
Monsa is a portfolio-analysis tool, not a broker or investment adviser. Nothing here is investment advice.
// related reading
What Is Portfolio Turnover and Why It Matters
What is portfolio turnover? Learn the SEC formula, worked examples, costs, taxes and benchmarks to judge if trading fits your strategy.
Watchlist Management: A Step-by-Step Guide for Traders
Master watchlist management with actionable steps to create, score, and prioritize your stock list. Learn thesis alignment and alerts setup for better
Florida Unemployment Amount: What You Will Actually Receive
Learn how the Florida unemployment amount is calculated, the $275 weekly cap, duration rules, and how partial earnings change your payment in 2026.
7 / 100 founding seats claimed - $100/yr locked, then $190/yr
Monsa is a portfolio-analysis tool, not a broker or investment adviser. It never recommends what to buy or sell - it checks what you hold against rules you wrote. Nothing here is investment advice.