// blog
Wide Moat Investing: How to Identify Durable Advantages

Title: Wide Moat Investing: How to Identify Durable Advantages
Conventional wisdom says to find a company with a wide moat, hold it, and let the label do the rest. That shortcut misses the central risk. A moat isn't a permanent badge attached to a stock. It's a claim that a business can protect excess profits for a defined period, and that claim needs to be checked as competitors, customers, technology, and management change.
Morningstar's framework gives the claim a precise meaning. A wide moat indicates that a company's competitive advantage is expected to last at least 20 years, while a narrow moat generally implies 10 years. The test combines a return on invested capital, or ROIC, above weighted average cost of capital, or WACC, with a structural source that prevents excess returns from fading quickly. Morningstar's equity research methodology makes duration central to the rating.
That makes wide moat investing less about collecting prestigious names and more about maintaining a live thesis. The useful question isn't only, “What protects this company today?” It's also, “What evidence would show that protection is weakening?”
Table of Contents
- What Wide Moat Investing Really Means
- The label is a starting point
- The Five Sources of a Wide Moat
- Cost advantage
- Intangible assets
- Switching costs
- Network effects
- Efficient scale
- The Numbers Behind a Wide Moat
- Quantitative Moat Screening Metrics
- What the Research Shows
- Academic Findings on Moat-Screened Portfolios
- Why Wide Moats Drift, Weaken, and Get Downgraded
- How a moat begins to narrow
- A Practical Wide Moat Checklist for Operators
- Add the financial overlay
- Turning the Checklist Into a Repeatable Process
- Define immediate revalidation triggers
What Wide Moat Investing Really Means
An economic moat is a structural advantage that lets a company sustain excess profits over a long period. The castle analogy helps when used carefully. A deep moat can keep attackers away for years, while a decorative fence offers little protection once a determined rival arrives.
In business, those attackers are competitors seeking customers, lower prices, talented employees, suppliers, or a company's technology. A wide moat means the business has a defensible structure that should keep ROIC above WACC for at least 20 years, as described in Morningstar's published methodology. The label therefore captures expected duration rather than merely present-day quality.
The label is a starting point
Strong earnings alone do not establish a moat. Profitability may reflect a temporary shortage, a favorable part of the business cycle, aggressive borrowing, or a product competitors can reproduce. The analysis needs a structural explanation for why excess returns can continue.
Morningstar identifies five possible sources: intangible assets, switching costs, network effects, cost advantage, and efficient scale. A credible thesis connects the company's economics to one or more of these mechanisms, then tests whether the protection remains intact.
Practical rule: Never write “wide moat” in a thesis without naming the mechanism that keeps competitors from taking the economics.
The rating can change as the business changes. Morningstar's 2024 Economic Moat Review covered 634 moat ratings, with 105 changes, including 58 upgrades and 47 downgrades. Wide-moat ratings reached nearly 20% of Morningstar's coverage, the highest level recorded in that review. The review summary shows why a moat rating belongs in an ongoing review process, not on a permanent list of approved companies.
A stock that appeared structurally protected in 2015 may face a different competitive environment today. New standards can reduce switching friction, a trusted brand can lose relevance, and once-exclusive technology can become widely available. The investor's job is to re-check the evidence, asking whether the original source of protection still supports the expected duration.
The Five Sources of a Wide Moat
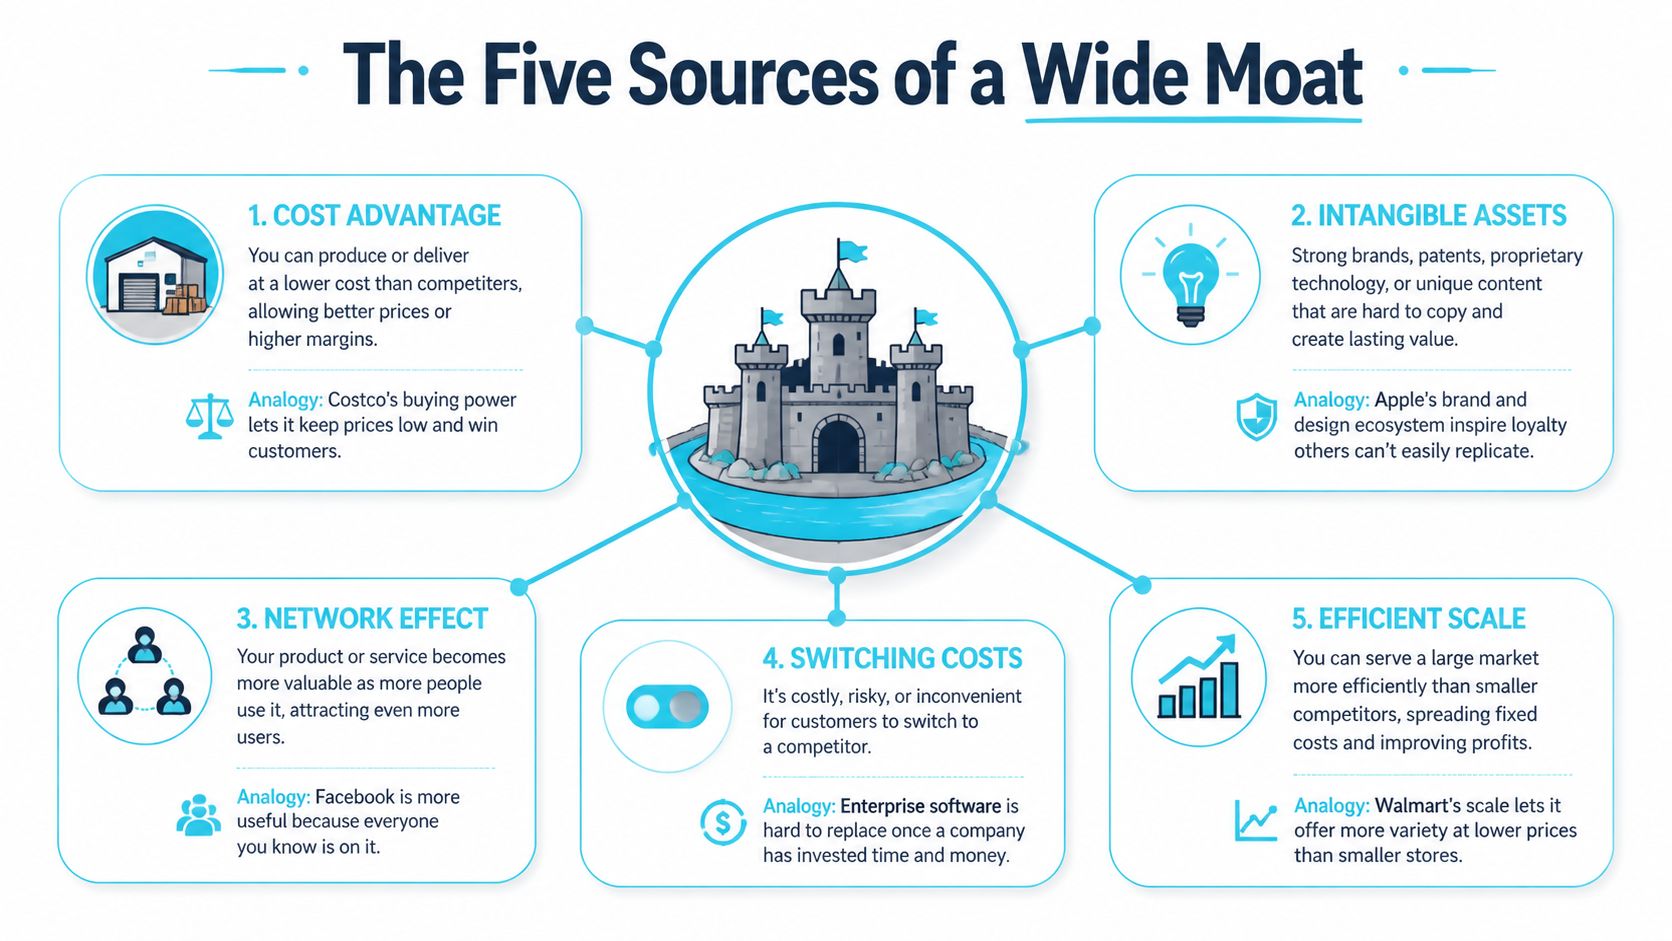
Morningstar's five sources provide a practical map for analysis. Each source creates a different barrier, so the evidence you seek must match the mechanism. Morningstar's explanation of economic moat ratings defines these sources and helps distinguish a genuine structural advantage from a temporary commercial strength.
Cost advantage
A cost advantage lets a company produce or distribute at a lower cost than rivals while preserving pricing flexibility. A giant warehouse buying toilet paper by the truckload has more bargaining power and lower unit costs than a small shop ordering individual cases.
Look for persistent gross-margin or operating-margin advantages, lower fulfillment costs, and evidence that scale benefits customers and shareholders rather than disappearing into price cuts. The key question is whether a competitor can reproduce the cost structure without matching the company's scale, location, process, or supplier relationships.
Intangible assets
Intangible assets include brands, patents, licenses, and other rights that shape customer behavior or restrict competition. A luxury handbag can command a price that a generic tote cannot because the brand carries meaning beyond the material itself.
Test whether customers choose the product for trust, status, habit, regulatory acceptance, or protected functionality. Pricing power, renewal behavior, patent protection, and regulatory barriers can support the case, but the analyst must ask whether the asset still matters to the next generation of buyers.
Switching costs
Switching costs create friction when customers move to an alternative. Changing a checking account involves paperwork and new routines. Migrating a business database can involve retraining, integration work, operational risk, and data conversion.
Useful cues include customer retention, renewal rates, implementation depth, contract duration, and the number of workflows embedded in the product. High retention alone isn't enough. Customers may stay because alternatives are temporarily weak, so examine what would make departure painful or risky.
Network effects
A network effect appears when each additional participant makes the service more useful to other participants. Payment networks and marketplaces are familiar examples. More merchants can attract more buyers, and more buyers can attract more merchants.
Measure the interaction between participant growth, engagement, liquidity, and switching behavior. A large user count isn't proof of a network effect if users don't create value for one another or if a rival can assemble the same network quickly.
Efficient scale
Efficient scale applies when a market can profitably support only one or a few providers. Local airports and municipal utilities often fit this logic because demand, infrastructure, geography, or regulation limits the number of viable entrants.
The evidence includes stable market structure, rational capacity, regulated access, and economics that deteriorate when too many providers enter. Analysts should distinguish efficient scale from ordinary size. A large company in a crowded market may have scale without a protected niche.
An analyst can also use this video overview of moat analysis as a visual supplement, but the written thesis still needs a specific source and observable evidence.
The Numbers Behind a Wide Moat
A wide moat is a claim about future economics, so the numbers must test its durability. Morningstar's framework looks for a company likely to earn ROIC above WACC for at least the next 10 years, supported by one of the five structural moat sources, as described in Morningstar's evidence on economic moats. That makes the label a live thesis: each review should ask whether the source of advantage still protects returns.
ROIC measures how efficiently a company turns invested capital into operating profit. WACC is the blended financing cost required by debt and equity providers. A company earning 15% ROIC against an 8% WACC produces a 7 percentage point spread. The spread matters when the business can defend it, reinvest at attractive rates, and maintain its position without continually consuming more capital.
Review the financial record across a full cycle. A cyclical producer may report impressive ROIC during a shortage, then show weak economics after supply normalizes. Compare direct peers as well. A margin that appears ordinary against the broad market may be exceptional in a specialized industry.
The thresholds below are screening guides from the analytical framework used for this review. They narrow the field, while the moat source explains why the result might persist.
Quantitative Moat Screening Metrics
| Metric | Definition | Wide-Moat Threshold |
|---|---|---|
| ROIC | Operating profit relative to invested capital | Sustained above 10% |
| ROIC versus WACC | Excess return after the cost of capital | Above WACC across the review period |
| Operating margin | Operating profit as a share of revenue | Top quartile of direct peers |
| ROE | Profitability relative to shareholders' equity | Above 15% over a full cycle |
| Free cash flow conversion | Free cash flow relative to the chosen earnings base | Above 80% |
A fundamental analysis software guide can help structure data collection and keep peer comparisons consistent. Quantitative screens confirm profitable economics; they cannot distinguish a network effect from a cost advantage or a temporary industry condition. That distinction requires an operator's checklist: examine pricing, retention, customer dependence, reinvestment returns, capacity, and the actions competitors could take.
The strongest evidence is a persistent spread over WACC, stable margins, disciplined capital needs, and a clear reason competitors cannot close the gap. Recheck each element as the company, industry, and competitive response change.
What the Research Shows
Research on moat-screened portfolios reaches different conclusions, so investors should treat the findings as conditional rather than universal. A 2016 study examined wide-moat portfolios against the S&P 500 and Russell 3000 using multiple risk-adjusted measures, including Carhart four-factor and Fama–French five-factor models. The study is available through the Applied Economics research record.
A later study covering 2013 through 2020 compared wide-moat firms in ordinary periods against stress periods such as the Covid shock. This pattern points to a possible role for moat quality in protecting cash generation and operating performance under stress, while leaving returns dependent on valuation, timing, and the competitive environment. The underlying evidence is summarized in Morningstar's research on wide-moat profitability and portfolio results.
Academic Findings on Moat-Screened Portfolios
| Study | Sample Period | Key Screen | Return Finding | Risk Finding |
|---|---|---|---|---|
| 2016 academic study | Earlier historical sample | Wide-moat portfolios | Assessed against the S&P 500 and Russell 3000 using multiple risk-adjusted measures, including factor-model alphas | Risk-adjusted evidence was reported |
| Later study | 2013–2020 | Wide-moat firms | Compared regular periods against the Covid shock | Results point toward resilience during stress |
A self-directed investor should therefore treat moat analysis as a business-quality filter rather than a promise of specific results. A label cannot replace examination of the five moat sources, the company's ability to preserve excess returns over a 20-year horizon, or the price paid for those economics.
Use the research as a starting map, then re-check the route. A company may defend profits through switching costs, network effects, intangible assets, cost advantages, or efficient scale, yet each source can weaken as customers, competitors, technology, and regulation change. The practical question is whether the operating evidence still supports the original thesis. “Can this company defend excess profits?” is more useful than asking whether the stock must deliver a particular result.
Why Wide Moats Drift, Weaken, and Get Downgraded
A moat often narrows gradually before financial statements register the change. A rival may introduce a credible substitute, customers may gain access to compatible tools, or management may divert investment away from the business that created the advantage. Revenue can remain healthy even as the cost of defending it rises, so the thesis needs regular re-checking rather than a permanent quality label.
Morningstar's rating changes make this process visible. Its H1 2025 report recorded 31 upgrades and 11 downgrades, while another 2025 review recorded 24 upgrades and 26 downgrades across more than 600 companies. The Morningstar moat-rating change report shows that analysts revise their view in both directions.

How a moat begins to narrow
Consider a company protected by switching costs. Customers may have integrated workflows, proprietary data, and extensive employee training tied to its platform. Open APIs and common standards can later simplify migration. Customers may still value the product, yet lower exit costs make renewal pricing harder to defend.
Each moat source has a distinct failure pattern:
- Pricing power can fade when alternatives become good enough.
- Brands can weaken as preferences shift across generations.
- Scale can lose value when focused entrants adopt more efficient processes.
- Network effects can stall if participants transact elsewhere.
- Efficient scale can break when regulation or technology expands the addressable market.
Give the thesis an operating scorecard. Record the current margin spread against peers, the year-over-year change in gross margin, capital intensity, research spending, reinvestment opportunities, and the latest competitive filing. Rising spending does not automatically indicate weakness. Spending that grows faster than the economic benefit deserves scrutiny.
Recent market data also separate business quality from valuation, as discussed in the cited Morningstar review of wide-moat stocks. These results show why a defensible business can still face valuation pressure or unfavorable sector composition. The operator's task is to connect all five moat sources to current evidence, then test whether excess returns still appear defendable over a 20-year horizon.
A Practical Wide Moat Checklist for Operators
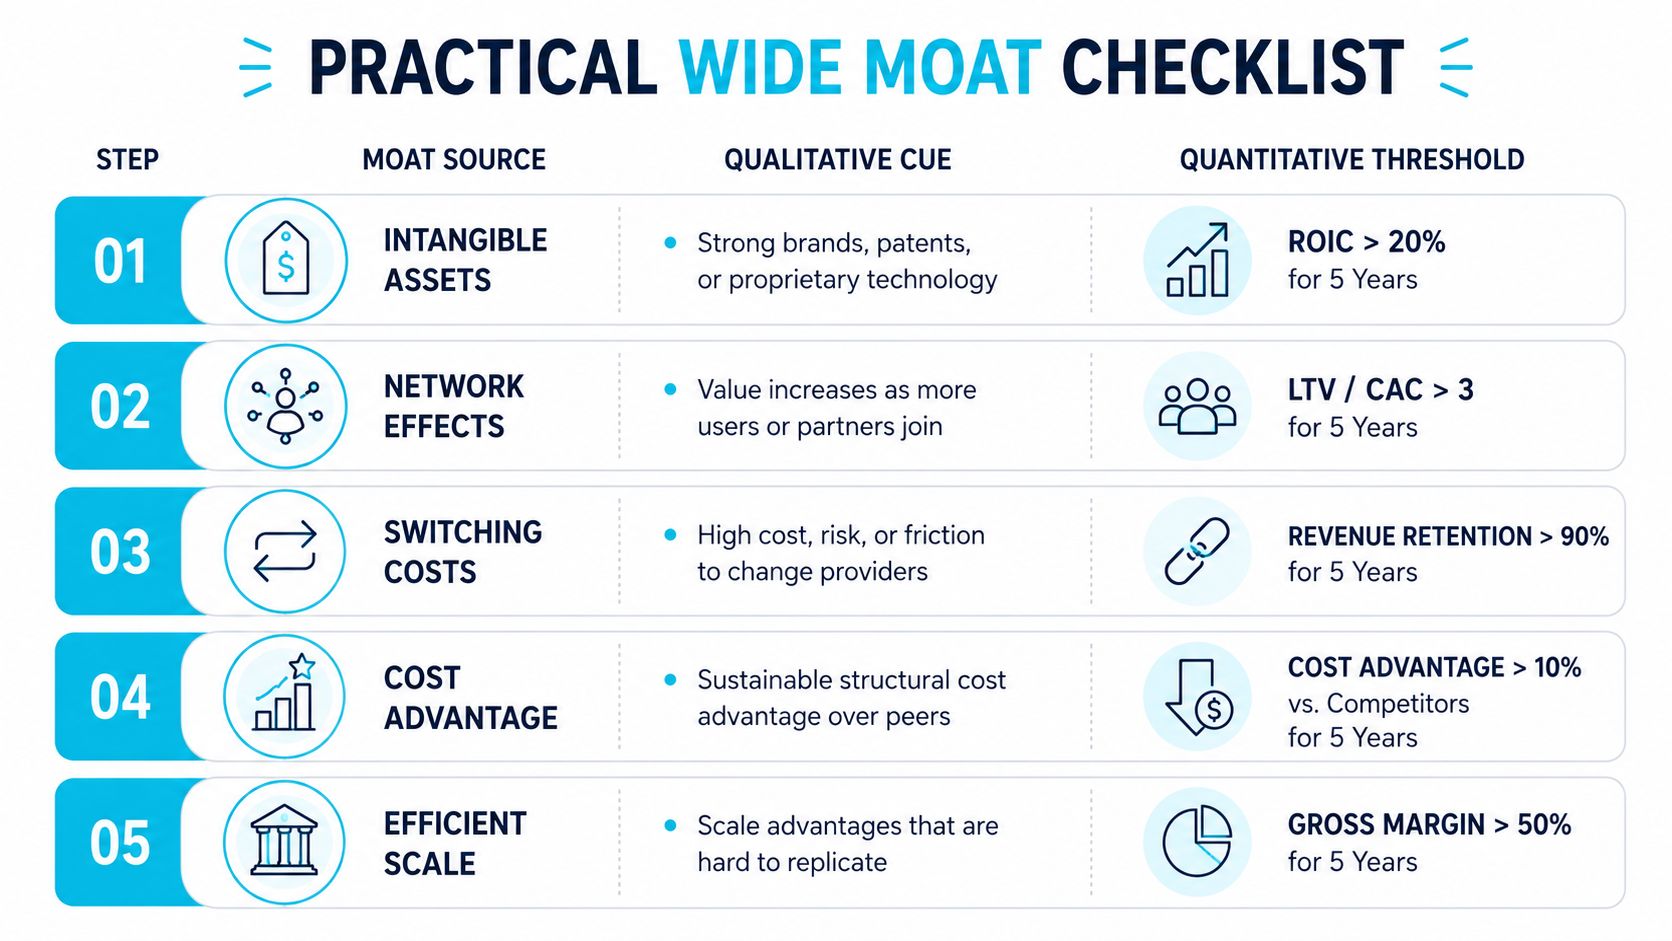
Operators need a repeatable way to translate a narrative into tests. Start with the moat source, then identify the evidence that would confirm it and the observation that would weaken it.
1. Test cost advantage. Compare gross margins, operating margins, procurement economics, fulfillment costs, and capital intensity with direct peers. Ask whether the advantage comes from durable scale or from a temporary input-price benefit.
2. Audit intangible assets. Identify the exact brand, patent, license, or approval that protects demand. Check pricing behavior, customer preference, renewal patterns, and the expiration or relevance of the underlying asset.
3. Confirm switching costs. Map the customer's implementation, training, data, and workflow dependencies. Review churn, renewal behavior, contract structure, and the practical steps required to move to a rival.
4. Measure network effects. Determine whether each new participant increases value for existing participants. For a marketplace, examine liquidity and repeat interaction. For a payment network, examine acceptance and usage rather than only counting participants.
5. Assess efficient scale. Define the niche, identify the number of economically viable providers, and examine whether new capacity would damage industry returns. A company's size alone doesn't establish efficient scale.
Add the financial overlay
Review five-year averages rather than relying on one favorable year. Require ROIC above WACC, gross margins above the sector median, and free cash flow conversion above 80% within the framework described earlier. Then compare the direction of each measure, because a company can pass a historical screen while its current economics deteriorate.
Use an investment checklist for structured review to record the evidence, not just the conclusion. The checklist should also flag customer concentration above 20%, revenue growth funded by acquisitions, and rising competitive intensity from new entrants. These conditions don't automatically invalidate a thesis, but they require a more demanding explanation.
A checklist earns trust when it records disconfirming evidence as carefully as confirming evidence.
Turning the Checklist Into a Repeatable Process
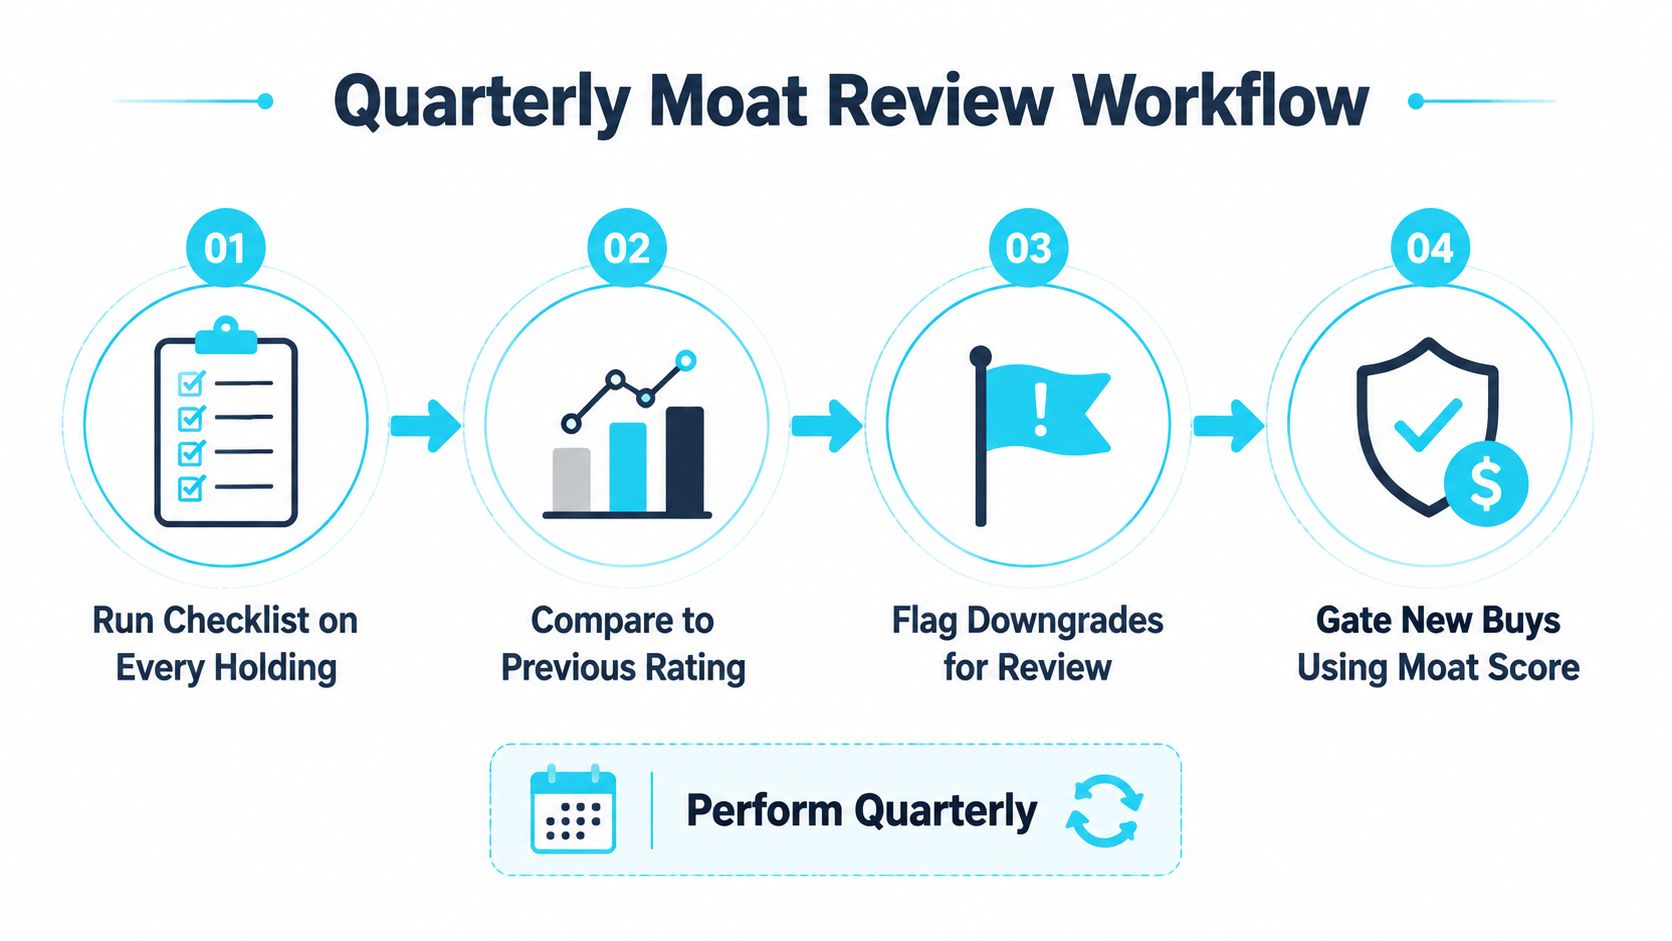
A moat review should become a recurring operating process, not a document written once and forgotten. Review every holding once a quarter, compare the current evidence with the prior rating, and record what changed in the business rather than only what changed in the share price.
Set a valuation gate for new positions. Use a conservative intrinsic-value estimate and a margin of safety instead of relying on a simple P/E cutoff. Valuation is part of the decision framework because even a durable business can be priced at a level that leaves little room for error.
Equal-weighting can also prevent one high-conviction name from dominating portfolio risk. Rebalancing rules should be written before concentration becomes uncomfortable, with sector and position limits reviewed alongside the moat thesis.
Define immediate revalidation triggers
Force an unscheduled review when any of these conditions appears:
- Margin pressure: operating margin compresses by more than two percentage points year over year.
- Capital economics: ROIC crosses below WACC.
- Competitive substitution: a rival announces a direct substitute at scale.
- Leadership change: management changes in the business unit that owns the moat.
Keep a living thesis log for every holding. Write one paragraph naming the moat source, the evidence supporting it, the main threat, the date it was last confirmed, and the next review date. A stock evaluation workflow can help organize those recurring checks, while the investor remains responsible for deciding whether the evidence still fits the written rules.
Monsa scores the stocks an operator holds against the strategy they wrote down, every night. Its deterministic rules handle the arithmetic, while AI handles qualitative judgments that require interpretation and shows the reasoning, so the score remains an inspectable process rather than a black box.
Use Monsa to turn a wide-moat thesis into explicit criteria, track whether each holding still fits those rules, and review the reasoning behind each verdict. Visit Monsa to build a repeatable strategy-versus-portfolio review process instead of relying on an old moat label.
Monsa is a portfolio-analysis tool, not a broker or investment adviser. Nothing here is investment advice.
// related reading
What Is Portfolio Turnover and Why It Matters
What is portfolio turnover? Learn the SEC formula, worked examples, costs, taxes and benchmarks to judge if trading fits your strategy.
Watchlist Management: A Step-by-Step Guide for Traders
Master watchlist management with actionable steps to create, score, and prioritize your stock list. Learn thesis alignment and alerts setup for better
Florida Unemployment Amount: What You Will Actually Receive
Learn how the Florida unemployment amount is calculated, the $275 weekly cap, duration rules, and how partial earnings change your payment in 2026.
7 / 100 founding seats claimed - $100/yr locked, then $190/yr
Monsa is a portfolio-analysis tool, not a broker or investment adviser. It never recommends what to buy or sell - it checks what you hold against rules you wrote. Nothing here is investment advice.